Figure 7.
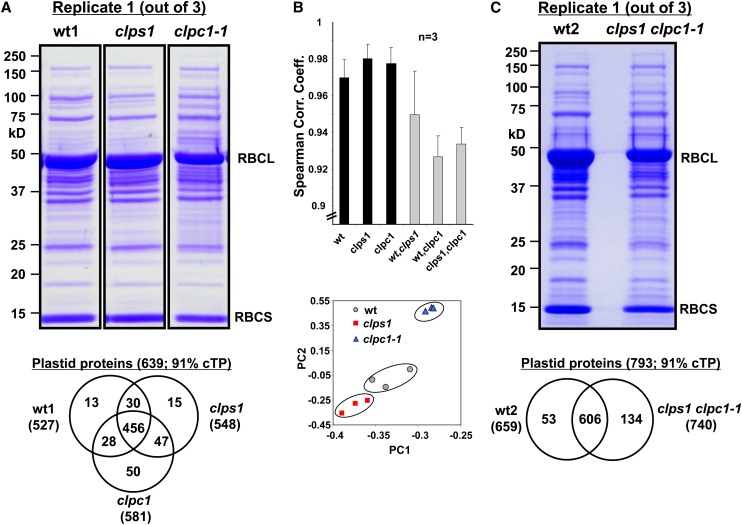
Comparative Proteomics of the Wild Type, clps1, clpc1-1, and clps1 clpc1-1.
(A) Representative Coomassie blue–stained SDS-PAGE gel image of stromal proteins from the wild type (wt), clps1, and clpc1-1. RBCL and RBCS accumulation levels are visibly reduced in clpc1-1. Each gel lane was cut in 10 slices and subjected to in-gel trypsin digestion and MS. The Venn diagram compares plastid proteins identified in wild-type, clps1, and clpc1-1 leaves.
(B) Spearman correlation and PCA of the quantified proteomes of the wild type, clps1, and clpc1-1 are shown. The symbols in the PCA plot represent each of the biological replicates for each of the three genotypes. Error bars show the sd.
(C) Coomassie blue–stained SDS-PAGE gel image of chloroplast stroma from wild-type and clps1 clpc1-1 plants. RBCL and RBCS accumulation levels are visibly reduced in clps1 clpc1-1. The Venn diagram summarizes the identified proteins in the wild type and double mutant. Spearman correlation and PCA analyses are shown in Supplemental Figure 5 online.
[See online article for color version of this figure.]

