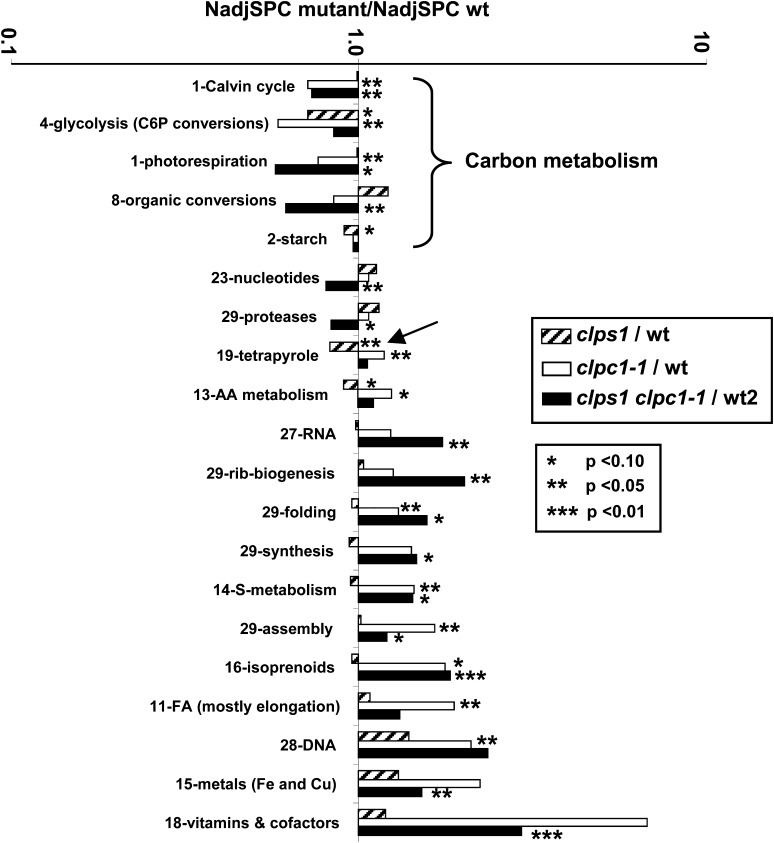
Figure 8.
Protein Mass Investment in Specific Plastid Functions in the Wild Type, clps1, clpc1-1, and clps1 clpc1-1.
Functions that were significantly over- or underrepresented in the mutants are marked with asterisks. Three levels of significance are distinguished (P < 0.1, P < 0.05, or P < 0.01) and were determined using a Student’s t test (matched-paired samples). The arrow highlights the reduced investments in tetrapyrrole metabolism in clps1 compared with the wild type. C6P, hexose phosphates; AA, amino acid; FA, fatty acids; wt, the wild type.

