Figure 1.
PD Closure Is Regulated by SA.
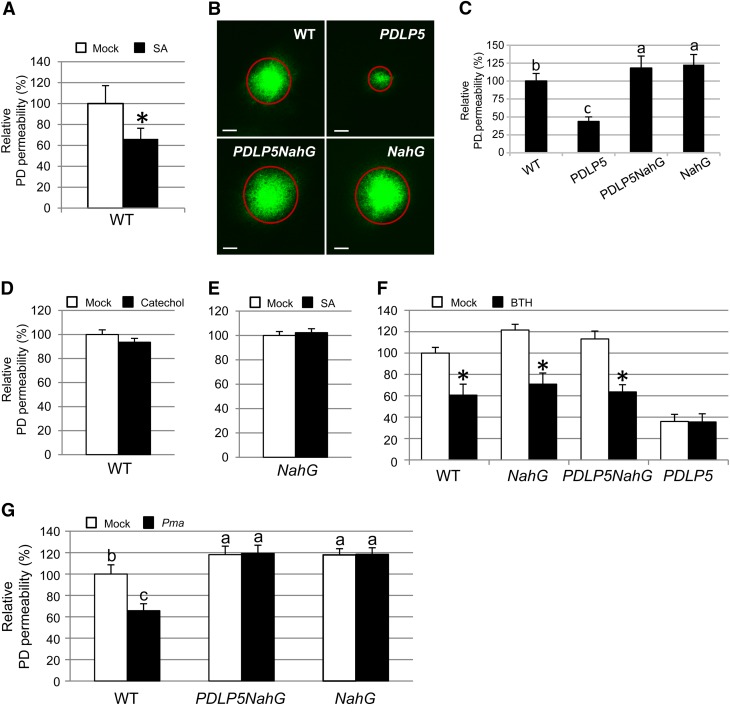
(A) Relative PD permeabilities of Col-0 plants 24 h after mock treatment or treatment with 100 μM SA. WT, the wild type.
(B) and (C) Comparison of PD permeabilities of wild-type Col-0, PDLP5, PDLP5NahG, and NahG plants.
(B) Confocal images showing representative CFDA movement in abaxial leaf surfaces. Circles represent the extent of dye diffusion. Bars = 200 μm.
(C) Quantification of CFDA movement. At least 10 plants were used per assay, and more than three repeats were performed.
(D) to (G) DANS assays showing changes in PD permeability in response to various chemicals (100 μM catechol [D], 100 μM SA [E], and 100 μM BTH [F]) and pathogen treatments (Pma ES4326 [OD600 = 0.001] [G]). Three-week-old plants were sprayed with chemicals or infected with Pma. DANS assays were performed at 24 h after treatments by loading CFDA for 5 min on the adaxial surfaces of fourth and fifth leaves and examining the abaxial surface for dye diffusion by a confocal microscopy. At least five individual plants were used per treatment, and two leaves (fourth and fifth) from each plant were subjected to DANS assays. At least two biological repeats were performed for quantification. Asterisks indicate a significant difference (P < 0.001) between two samples. Levels not connected by the same letters are significantly different at the α = 0.05 level according to the LSD test following one-way ANOVA. Bars indicate se.
[See online article for color version of this figure.]

