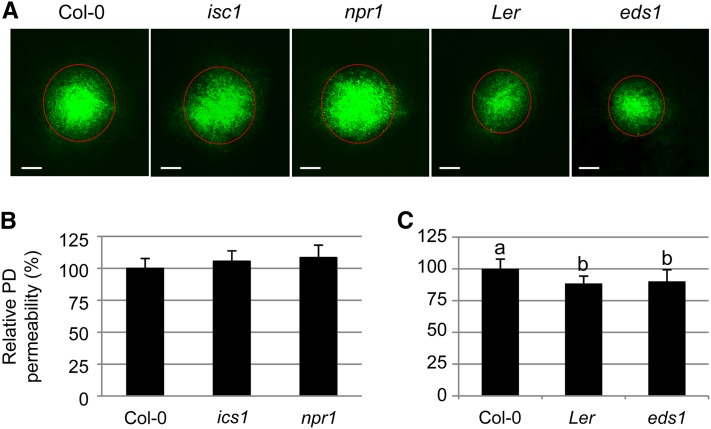
Figure 5.
Basal PD Permeability in SA Mutants Is Normal.
(A) Representative confocal images of abaxial leaf surfaces showing basal PD permeability in Col-0, ics1, npr1, Ler, and eds1. Bars = 200 μm.
(B) and (C) Quantitative comparison of PD permeability in ics1 and npr1 compared with wild-type Col-0 (B) and eds1 compared with wild-type Ler (C). For each genetic background, at least five individual plants were used for DANS assays with at least two biological repeats. Levels not connected by same letters are significantly different at the α = 0.05 level based on LSD test following one-way ANOVA. Bars indicate se.
[See online article for color version of this figure.]

