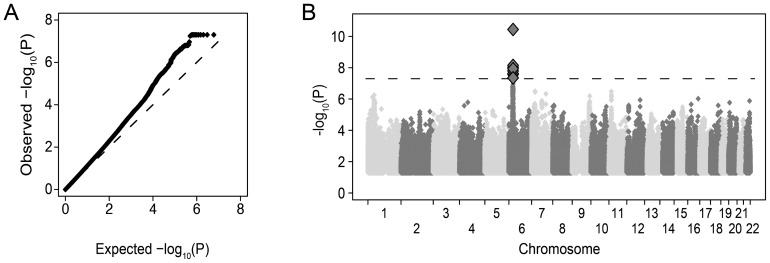
Figure 1. Association results for approximately 8 million common DNA variants tested for an impact on HIV-1 acquisition.
A) Quantile-quantile plot of association results after meta-analysis across the six groups. For each variant tested, the observed −log10 p-value is plotted against the null expectation (dashed line). P-values lower than 5×10⁻⁸ are truncated for visual effect. B) Manhattan plot of association results where each variant is plotted by genomic position (x-axis) and −log10 p-value (y-axis). Only variants in the MHC region on chromosome 6 have p-values below genome-wide significance (p<5×10⁻⁸ dashed line, large diamonds).

