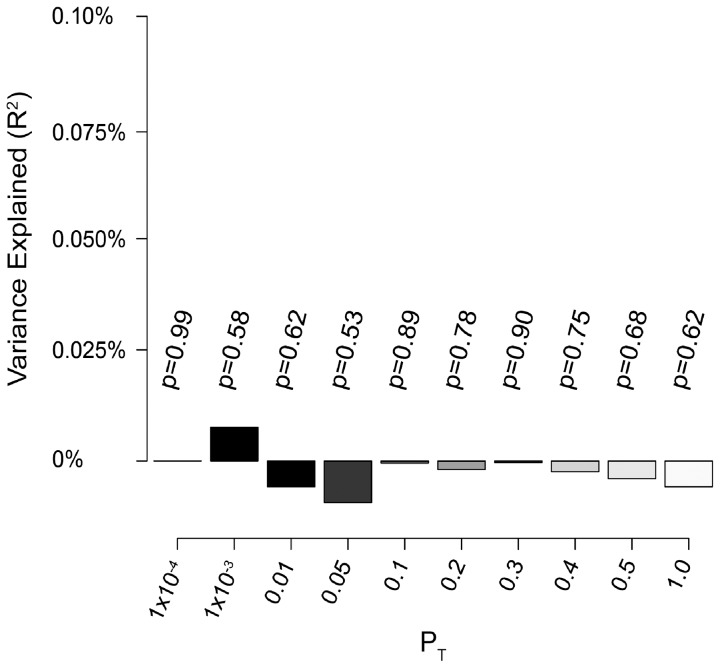
Figure 3. Analysis of bulk SNP effects shows no evidence for enrichment of association signal across data sets.
LD pruned SNP sets falling below various p-value thresholds (grey shades, x-axis) were selected based on association results calculated in five of six groups (discovery set). Per individual scores were calculated in a non-overlapping test set (Group 3) by summing the beta-weighted dosage of all SNPs in that set. Model p-value (listed above bars) and variance explained (using Nagelkerke's pseudo R2, y-axis) were calculated by regressing phenotype on per individual score using logistic regression.

