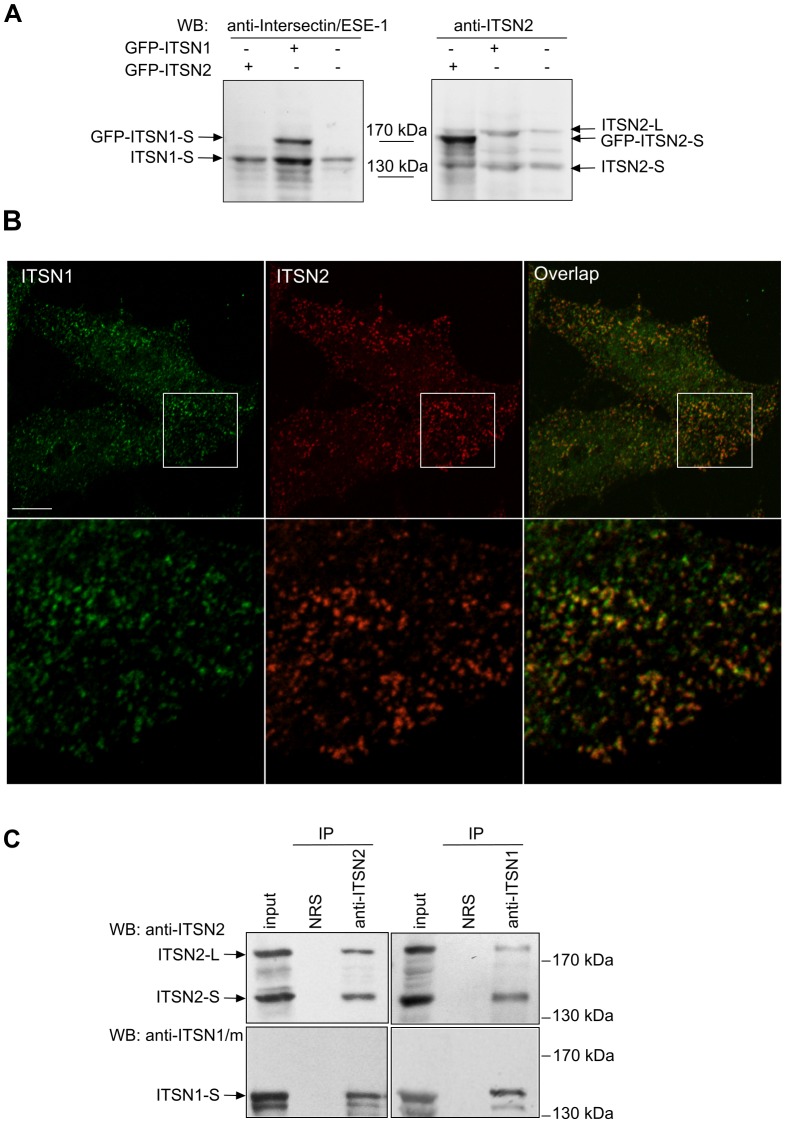
Figure 1. ITSN1 and ITSN2 are associated in cells.
(A) Characterization of the anti-ITSN2 antibodies produced. Nontransfected HEK293 cells or cells expressing GFP-ITSN1-S or GFP-ITSN2-S were lysed 24 h post-transfection. Total cell lysates were resolved by SDS-PAGE with subsequent immunoblot analysis using the anti-ITSN2 antibodies obtained or the commercially available anti-Intersectin/ESE-1. (B) HEK293 cells were plated on coverslips and fixed. Endogenous ITSNs were stained with anti-ITSN1/m and anti-ITSN2 antibodies, and visualized with Alexa 488-conjugated or Texas Red-conjugated secondary antibodies, respectively. Higher magnification of the area enclosed by a rectangle is shown below each image. Scale bar: 10 µm. (C) Lysates of HEK293 cells were subjected to immunoprecipitation using anti-ITSN2 antibodies (left panels). Conversely immunoprecipitation was performed using rabbit polyclonal antibodies against ITSN1 (right panels). In both cases immunoprecipitated material was probed with antibodies specific to ITSN1 and ITSN2. Representative data from three independent experiments are shown. IP, immunoprecipitation; NRS, normal rabbit serum; WB, Western blotting.

