
Figure 3. Expression levels of spvA (black bars), mgtA (light grey bars) and rpoS (dark grey bars) in the StpA(E42Del) and the PhoQ(L13Q) mutant relative to wild type levels.
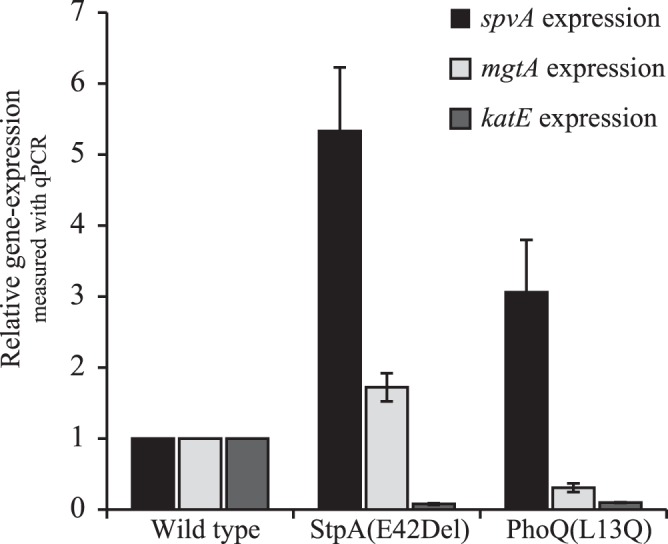
All expression levels are relative to the dnaE mRNA levels in each RNA sample. Error-bars are SEM.