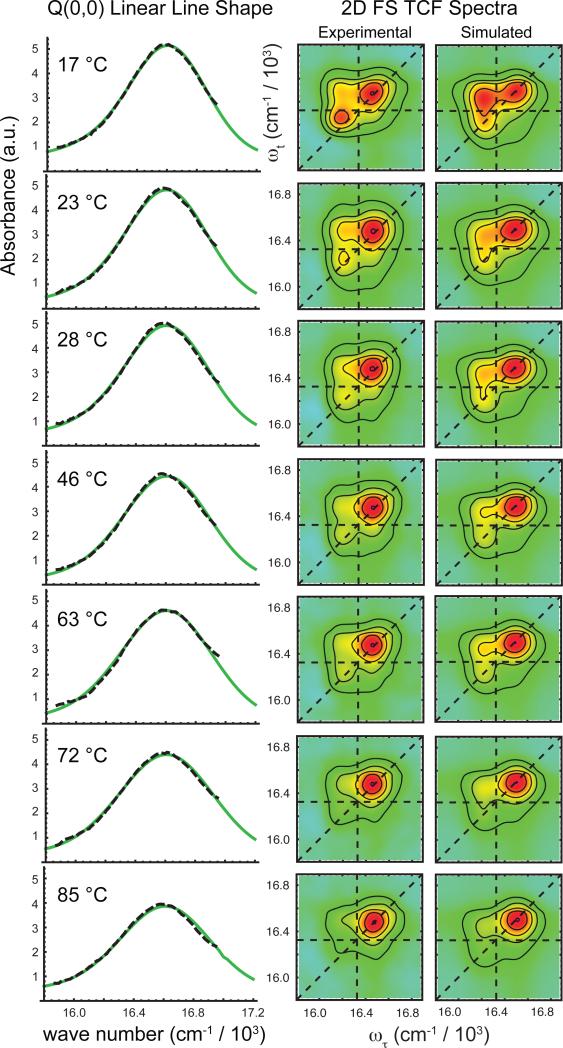
Figure 6.
Temperature-dependent 2D FS and linear absorption data, and optimized fits. Left column: The linear absorption spectrum of the Q(0,0) band of (ZnTPP)2 dimers in DSPC liposomes (dashed black) is overlaid with its optimized fit (green) for each of the seven temperatures investigated. Right column: The real part of the 2D FS total correlation spectra is compared to its optimized fit for each temperature. As the temperature is increased, the red-shifted diagonal peak and the above diagonal cross peak decrease in intensity, corresponding to a loss in the relative population of J-dimer conformation. These temperature-dependent changes in the 2D spectral line shapes are consistent with those observed in the B-band of the linear absorption spectra.

