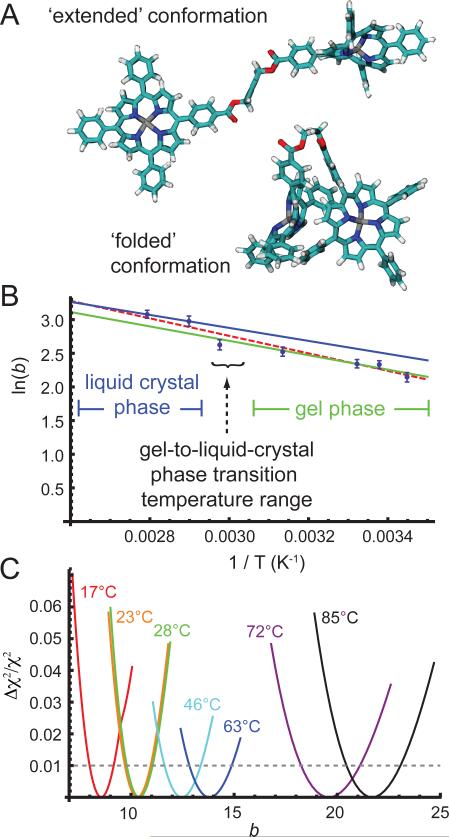
Figure 7.
(A) Models of ‘extended’ and ‘folded’ conformations of the zinc porphyrin tweezer from the UFF structure optimizations. (B) Van't Hoff plot of the parameter ln(b) versus inverse temperature, where b is the ratio of H- to J-dimer population. Blue points with error bars are the values of b obtained from the optimizations to the linear absorption and 2D FS spectra over the full range of temperatures shown in Fig. 6. The linear fits to these points (green and blue lines) yield the standard state changes in entropy and enthalpy associated with the ‘extended’-to-‘folded’ conformational transitions in the gel and liquid-crystal phases, respectively. See Table 2 for values. (C) The relative deviation of the cost function from the optimized reference value is plotted as a function of the parameter b. Cross-sections of the cost function at each temperature have minima corresponding to the optimized value bref. The cross-section curvatures indicate the sensitivity of the optimizations to the uncertainty Δb = b – bref. Trust intervals were directly read out from these plots based on the approximately 1% relative error associated with the experimental data quality (indicated by the dashed horizontal black line).

