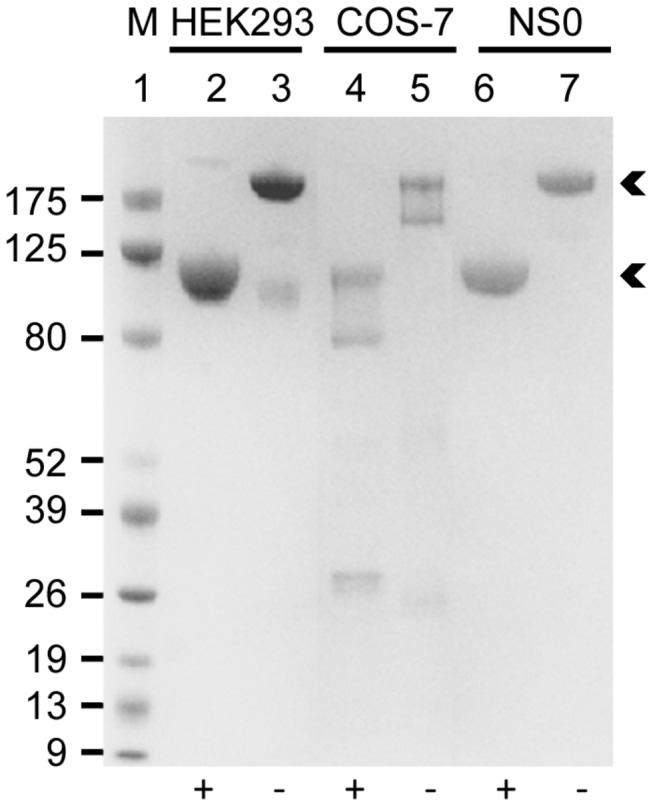
Figure 2. Comparison of ICAM-1-Fc by Sodium dodecyl sulfate polyacrylamide gel electrophoresis (SDS-PAGE).

SDS-PAGE gel electrophoresis of 5 µg of ICAM-1-Fc expressed in HEK293 cells, COS-7 cells or in mouse myeloma NS0 (R&D Systems) cells. 5 µl protein marker (M) was loaded onto the gel. Samples were reduced using DTT (+) or non-reduced (−). Arrows indicate ICAM-1-Fc bands.
