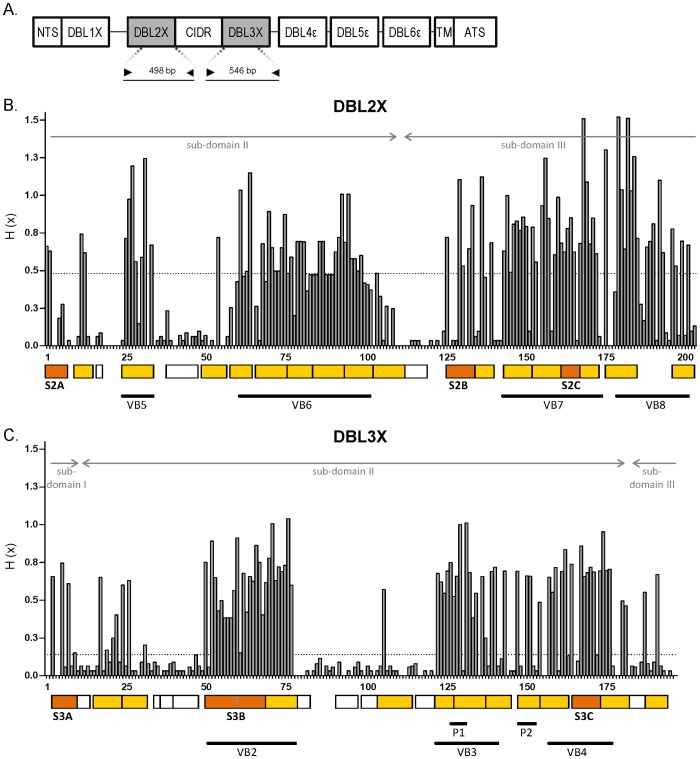
Figure 1. Variability in DBL2X and DBL3X amino acid sequences.
(A) VAR2CSA domain structure and regions covered by sequencing in the reference strain A4 (NTS: N-terminal segment; DBL, Duffy-binding like; CIDR, cysteine-rich inter-domain region, TM: trans-membrane; ATS: acidic-terminal segment). (B, C) Shannon entropy values were calculated on the multiple sequence alignment of 176 DBL2X (and Dataset S1) and 191 DBL3X amino acid sequences (and Dataset S2) transcribed by placental parasites. Dotted horizontal lines indicate median of all positive entropy values (HDBL2X = 0.48 and HDBL3X = 0.14). Arrows indicate DBL sub-domain boundaries [16]. White boxes delimit segments with residues below the entropy threshold; colored boxes delimit variable segments carrying signatures not associated (yellow) or associated with high placental parasite density (orange, Bonferroni corrected Wald test: P[S2A] = 0.0020, P[S2B, S2C, S3A and S3B]<0.001; P[S3C] = 0.0032). Regions corresponding to previously reported parity-linked motifs (P1, P2) [34], [35] and variable blocks (VB) [38] are underlined.

