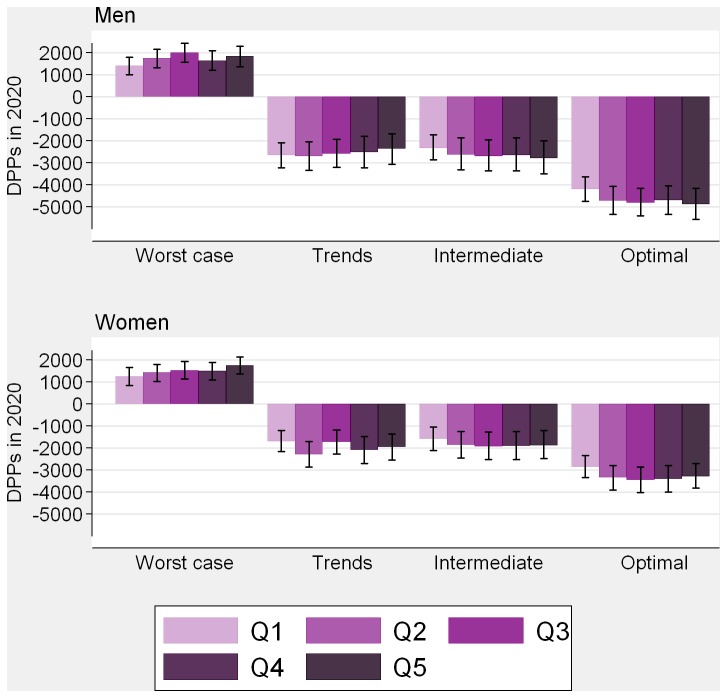
Figure 1. Reduction in CHD deaths in 2020 by risk factor change scenario.
DPPs, deaths prevented or postponed. Q1 = least deprived; Q5 = most deprived. Positive DPPs show additional deaths representing adverse risk factor trends; negative DPPs show risk factor reduction. 95% uncertainty intervals shown by I bars.

