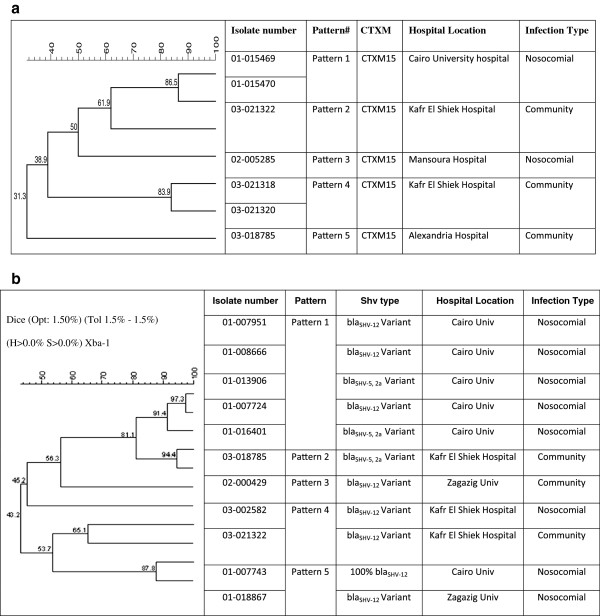
Figure 2.
PFGE Analysis. 2a. PFGE analysis of the seven CTXM-15 K. pneumoniae producers strains. The dendrogram was constructed with dice coefficient, complete linkage, and 1.5% position tolerance. The degree of relatedness between K. pneumoniae isolates and those from GenBank is shown on the branches. 2b. PFGE analysis of the 11 K. pneumoniae strains producing SHV-12, SHV5 and SHV-2a. The dendrogram was constructed with dice coefficient, complete linkage, and 1.5% position tolerance. The degree of relatedness among K. pneumoniae isolates and those from GenBank is shown on the branches.

