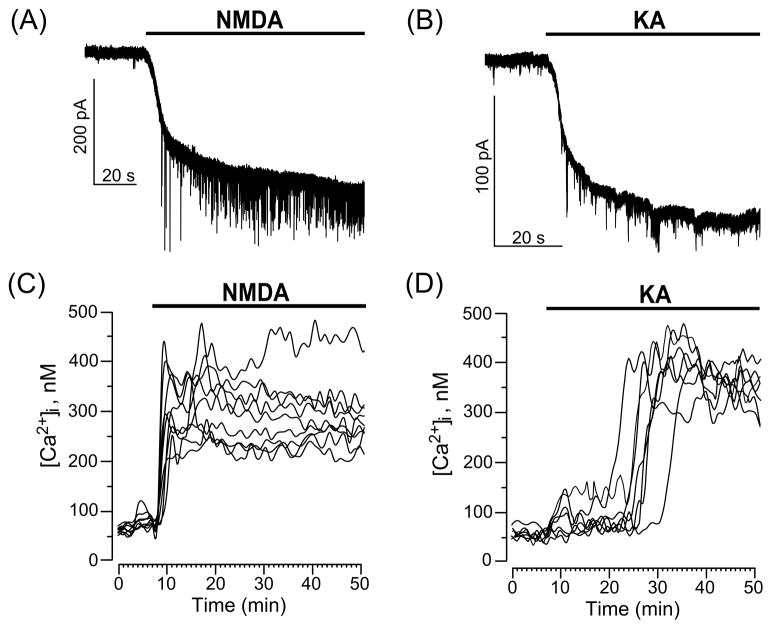
Fig. 1.
Current and Ca2+ responses of cultured cortical neurons to application of GluR agonists, NMDA and KA. (A) Representative whole-cell currents illustrating neuronal responses of cultured cortical neurons to application of 30 μM NMDA. (B) Representative whole-cell currents illustrating the response of cultured cortical neurons to application of 30 μM KA. The time of agonist application is indicated by the line above the traces. (C) Sustained Ca2+-responses of neurons loaded with Fura-2 upon application of 30 μM NMDA (time of application shown by the line above the traces). Each trace represents the response of one neuron. Data from one experiment are plotted. Number of experiments (N) = 4. (D) Ca2+-responses of neurons loaded with Fura-2 upon application of 30 μM KA (time of application shown by the line above the traces). Each trace represents the response of one neuron. Data from one experiment are plotted.(N = 4)

