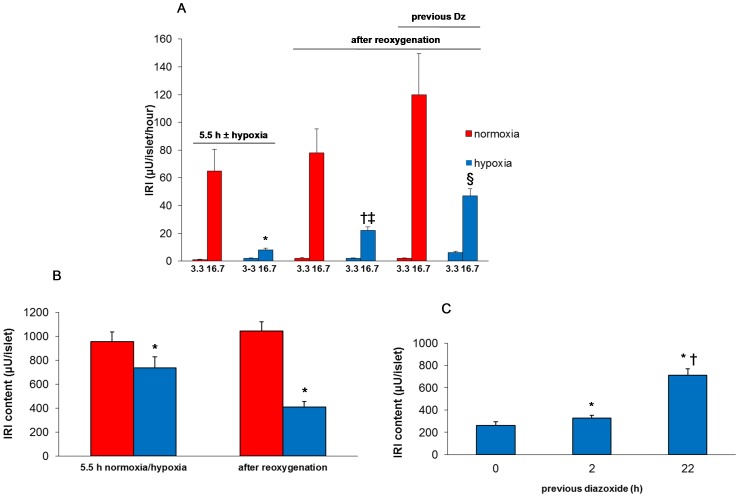
Figure 3. Effects of hypoxia and diazoxide on insulin secretion and islet insulin content.
Shown are in A immediate effects (left part of figure) by 5.5 h of hypoxia on secretion and late effects, i.e. after re-oxygenation (right part of figure) including preconditioning with diazoxide (Dz). Glucose-induced insulin secretion was assessed in incubations with 3.3 and 16.7 mmol/l glucose. B and C depict islet insulin content. Mean ± SEM of seven experiments. In A: *P<0.02 vs. normoxia; † P<0.01 vs. no re-oxygenation; ‡ P<0.02 vs. normoxia after re-oxygenation. In B: *P<0.02 vs. uninterrupted normoxia. In A: § P = 0.027 vs. no previous diazoxide. In C: *P<0.001 for an effect of 22 h and † P<0.01 for an effect of 2 h of previous diazoxide. Red columns: normoxia; blue columns: hypoxia.

