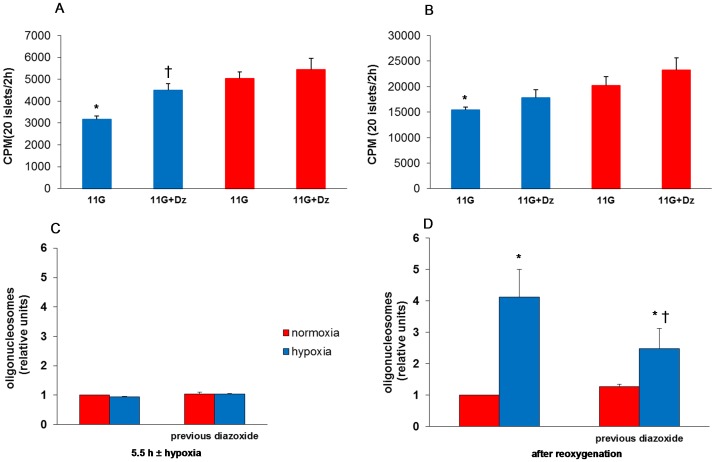
Figure 4. Effect of hypoxia and preconditioning with diazoxide (22 h) on biosynthesis and necrosis.
A depicts insulin biosynthesis and B: total protein biosynthesis. Mean ± SEM of six experiments in A and B. In A: *P = 0.01 vs. normoxia, †P<0.03 vs. no previous diazoxide. In B: *P = 0.01 vs. normoxia. C depicts effect of preconditioning with diazoxide on necrosis measured in cell culture supernatants directly after hypoxia and D when measured after re-oxygenation. Mean ± SEM of four experiments in C and D. In D: *P<0.05 vs. normoxia, †P<0.05 vs. no previous diazoxide. Red columns: normoxia; blue columns: hypoxia.

