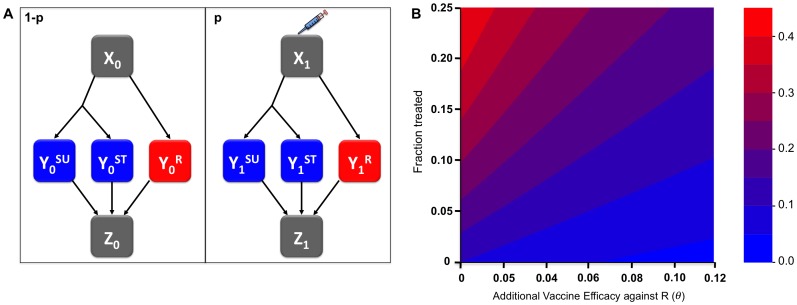
Figure 3. Modeling a vaccine with increased efficacy against drug-resistance determinants for an epidemic pathogen (seasonal influenza).
a, SIR model with a proportion  of the population as vaccinated susceptibles (
 subscript) and
  as unvaccinated susceptibles (
 subscript), who can get infected with either the drug-sensitive (
 superscript) or –resistant (
 superscript) strains, get treated (
 superscript) or not (
 superscript) and are removed due to recovery or death (
 ). This is the model of Ref. [2], modified to include vaccination. b, Model evaluations for final cumulative proportion resistant among all infections over the course of one season, as a function of the additional vaccine efficacy
  against resistant, compared to sensitive strains (x-axis) and the fraction of influenza infections treated (y-axis). Here, vaccine coverage is 40% and
  = 59%.

