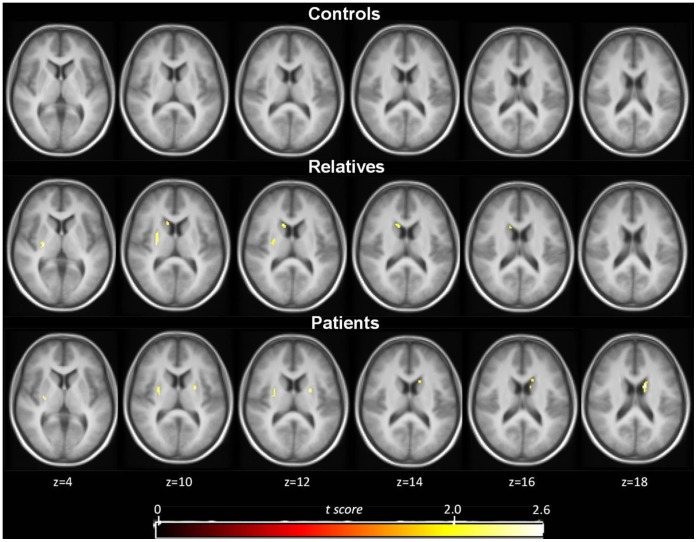
Figure 3. Mean statistical parametric t map of γ showing only the striatal voxels that show significant dopamine release surviving the t >2.4 threshold (p<0.01) in controls (top row, n = 9), relatives (middle row, n = 8) and patients (bottom row, n = 7).
T maps are shown at the level of t >2.4 in transversal sections overlaid on a MRI template.

