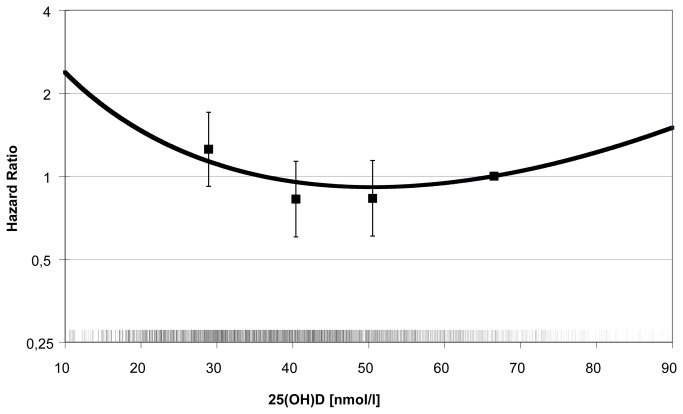
Figure 3. Nonlinear association between plasma 25(OH)D and incident stroke.
The curve represents the following second degree fractional polynomial function of 25(OH)D that is significantly (p<0.01) associated with incident stroke after multivariable adjustment: HR stroke = exp[((x)1 ×(-0.19457) + (x)1 ×(0.03954)×log(x)) – ((66.5)1 ×(-0.19457) + (66.5)1 ×(0. 03954)×log(x))];
Additionally, hazard ratios of stroke by 25(OH)D quartiles from the fully adjusted model are presented. The reference for the polynomial function was set at 66.5 nmol/L, the median value in the highest 25(OH)D quartile. The short vertical ticks above the horizontal axis represent the distribution of season-standardized 25(OH)D values in incident stroke cases and the subcohort.

