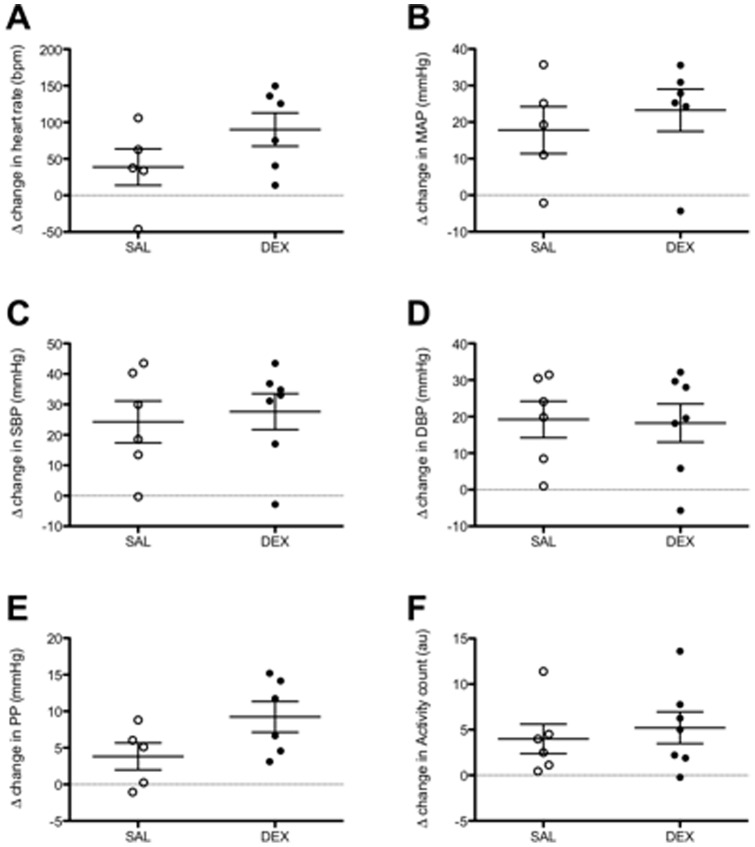
Figure 4. Heart rate, mean arterial pressure and pulse pressure responses to restraint stress.
The delta change heart rate (A), mean arterial pressure (MAP; B) and pulse pressure (PP; C) after exposing the aged male mice to a 15 minute restraint stress from baseline values. The data points represent the Δ value between the mean of the data sampled during the restraint stress (10 seconds every minute for 15 minutes) from the baseline value (mean of data sampled 10 seconds every 5 minutes in the hour immediately prior to the restraint stress). SAL (open circles), DEX (closed circles). Data presented as the mean ± SEM. N = 6–7 litters (one animal per litter).

