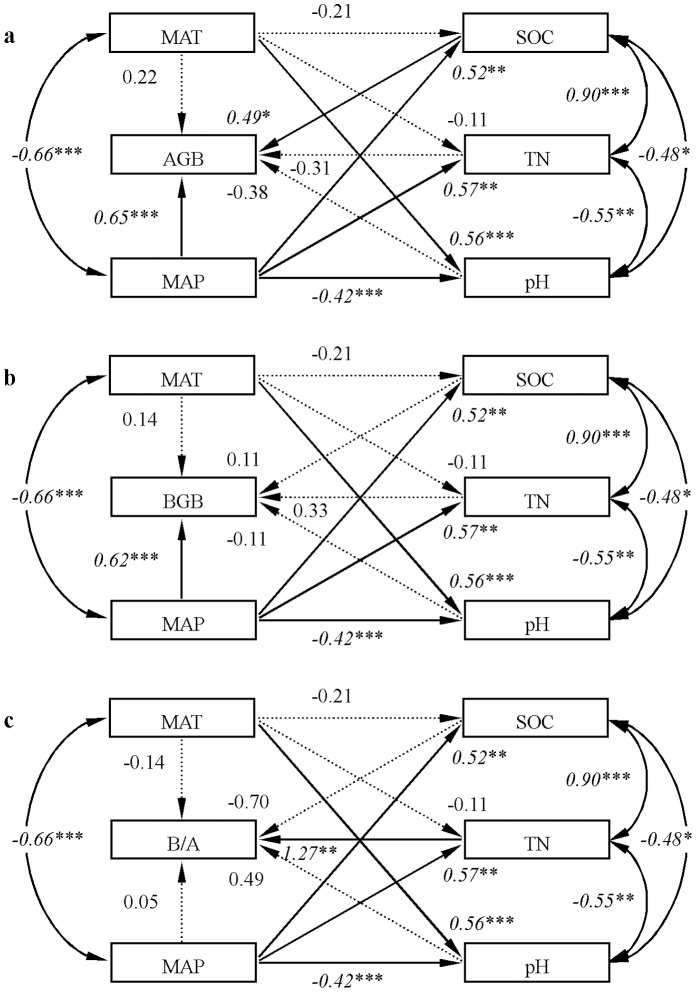
Figure 3. Results of structural equation models for: a) aboveground biomass (AGB), b) belowground biomass (BGB), and c) belowground to aboveground biomass ratio (B/A).
Each arrow represents a direct linear causal relationship. The arcs show the correlation between two variables. Values on arrows are path coefficients and on arcs are standardized correlation coefficients. Italic values indicate the coefficients are significant at P<0.05 (*), P<0.01 (**), and P<0.001 (***). The coefficients that are not statistically significant are shown by dashed arrows. All values are log-log transformed.

