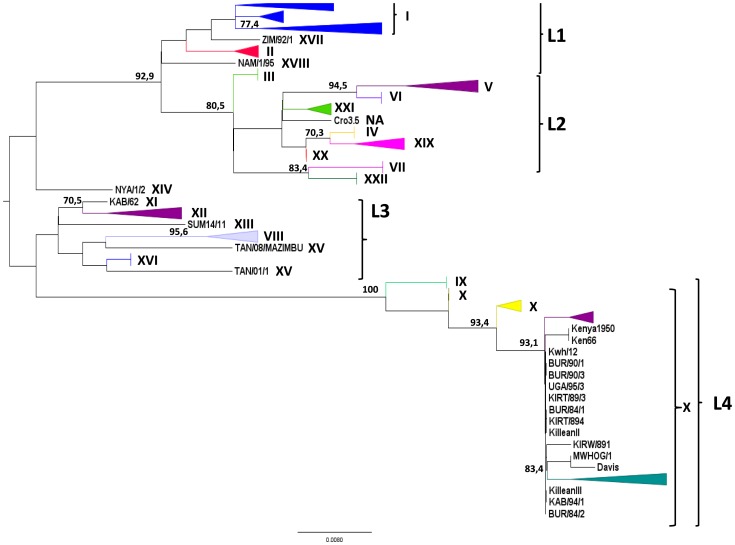
Figure 3. B646L gene phylogenetic tree describing ASFV relationships.
The tree was constructed under HKY85+ evolutionary model with 1,000 bootstrap resampling. Numbers indicate the statistical value (Expected-Likelihood Weight) of internal nodes, given in percentages (only numbers higher than 70 are indicated). Lineages were collapsed for improved tree visibility. The tree shows four main lineages (L1 to L4).

