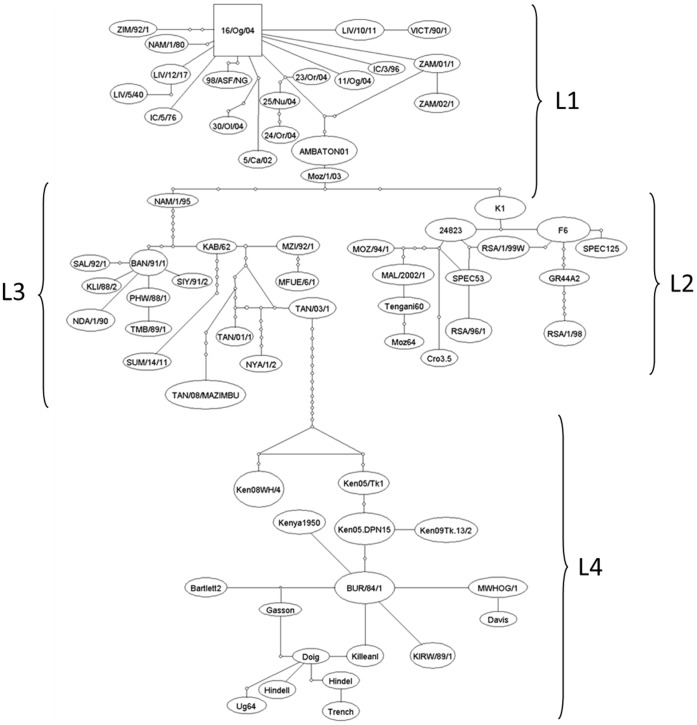
Figure 4. Haplotype network constructed with TCS software.
The network shows the same four main lineages that were observed in the bifurcative phylogenetic tree constructed in maximum likelihood under the HKY+ model, but clearly demonstrates that relationships between some ASFV isolates are too complex to be resolved by only bifurcations.

