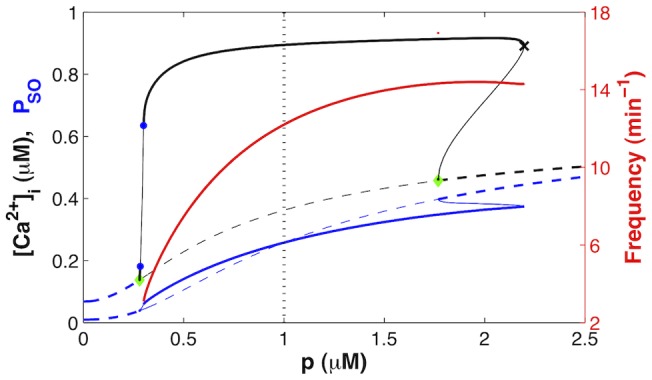
Figure 4.
 dynamics as a function of agonist concentration.

Dashed curves represent steady-states (constant  levels); solid curves, periodic solutions (
 oscillations). The maximum
  (black) and the maximum fraction of open SOCC (blue) during one solution period are plotted as ordinates. The red curve (right y-axis) shows the frequency of the
  oscillations on the main stable segment (from the upper blue dot to the black cross), which fits the experimental range in human [2]. The stable solutions are represented as thick lines and unstable solutions as thin lines. The green diamonds represent Hopf bifurcations, the black cross, a saddle-node bifurcation, and the blue dots, period-doubling points. Period-doubled branches are not shown because they extend only over a tiny range of
  values; moreover it is likely that the deterministic description of
  oscillations fails at these low agonist concentrations (see Discussion). The vertical dotted line indicates the value of
  used in Fig. 3 (Table 1).
