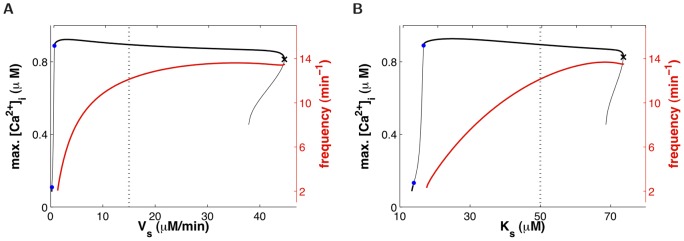
Figure 5. Influence of SOCE on agonist-induced  oscillations.

Amplitude (black) and frequency (red) of  oscillations as a function of (A) SOCE maximum rate,
  , and (B) STIM affinity for SR
  ,
,  . Dotted lines indicate the “normal” parameter values (Table 1, Figs. 3D–F). As in Fig. 4, only the frequency of the large-amplitude stable
  oscillations is shown.
