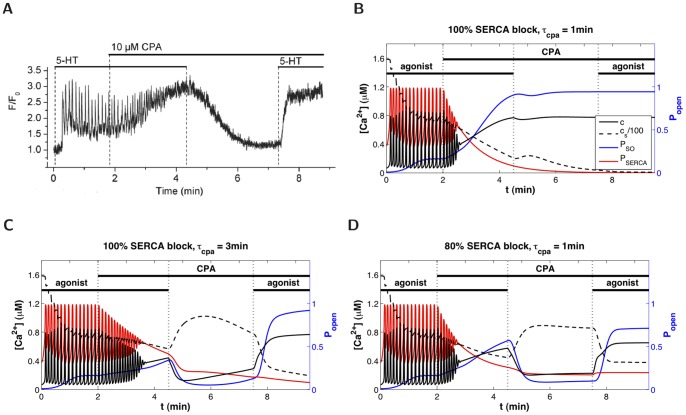
Figure 6. Effect of CPA on  dynamics.
(A) Fluorescence imaging of  in ASMC of a mouse lung slice treated with agonist and CPA. Agonist removal leads to
  decrease. (B–D) Model simulations of the experiments shown in (A), assuming that (B) CPA quickly blocks the SERCA, (C) CPA slowly blocks the SERCA, (D) CPA partially blocks the SERCA but reaches maximum strength rather quickly. Black solid and dashed curves (left y-axis) represent respectively
  and
and  ; blue and red curves (right y-axis) show respectively the fraction of open SOCC and the fraction of operating SERCA (that is,
  , where
  is given by Eq. (0c)).

