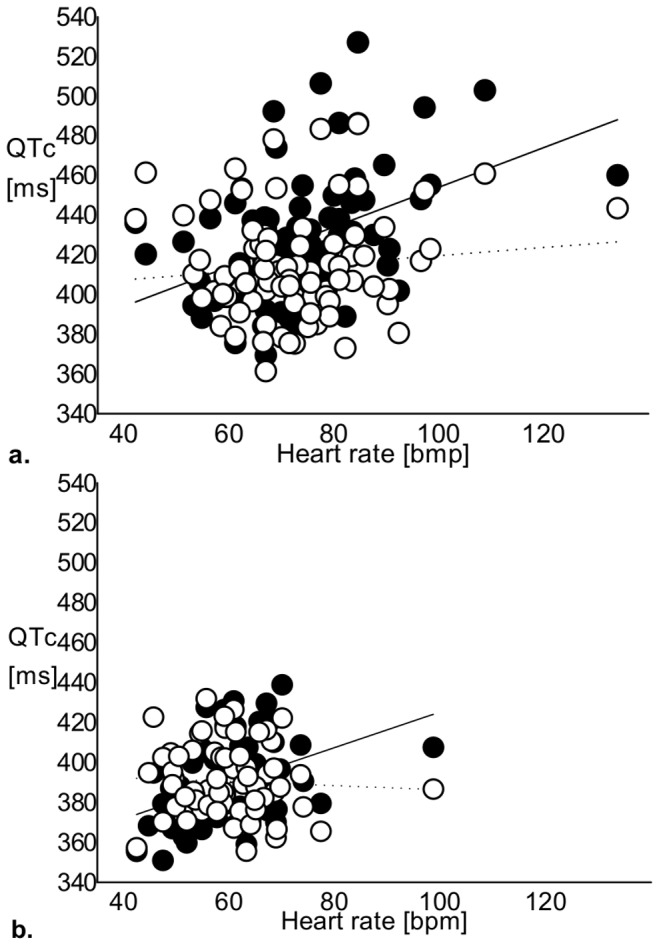
Figure 1. Heart rate plotted against QTc length.

a. Heart rate plotted against QTc length in women with TS. Hodges’s formula (open circles, dashed regression line, r2 = 0.012; p = 0.3) effectively omitted the dependence of QTc on heart rate when compared to Bazett’s formula (filled circles, solid regression line, r2 = 0.200; p<0.001). b. Heart rate plotted against QTc length in controls. Hodges’s formula (open circles, dashed regression line, r2 = 0.003; p = 0.7) effectively omitted the dependence of QTc on heart rate when compared to Bazett’s formula (filled circles, solid regression line, r2 = 0.161; p = 0.001). ms = milliseconds, bpm = beats per minute.
