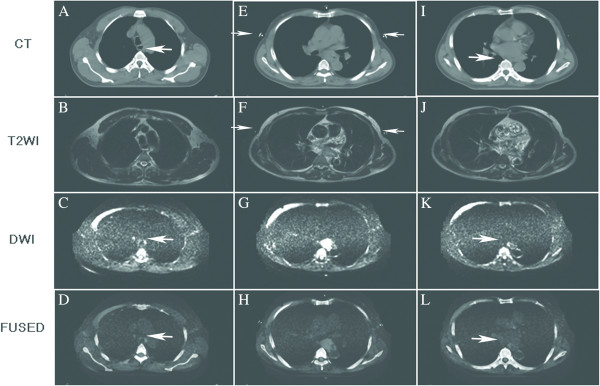
Figure 4.

Different images show the GTV upper boundary, the largest GTV slice and the GTV lower boundary. (A-D) GTV upper boundary (white arrow) on CT images, T2W images, DWI scans and the fused images; In C and D, the white arrow indicates the upper boundary on DWI scans and fused images. (E-H) largest GTV slice on images; In E and F, the white arrow indicates the modules on CT image and T2WI image. (I-L) GTV lower boundary (white arrow) on CT images, T2W images, DWI scans and fused images; In K and L, the white arrow indicates the lower boundary on DWI scans and fused images.
