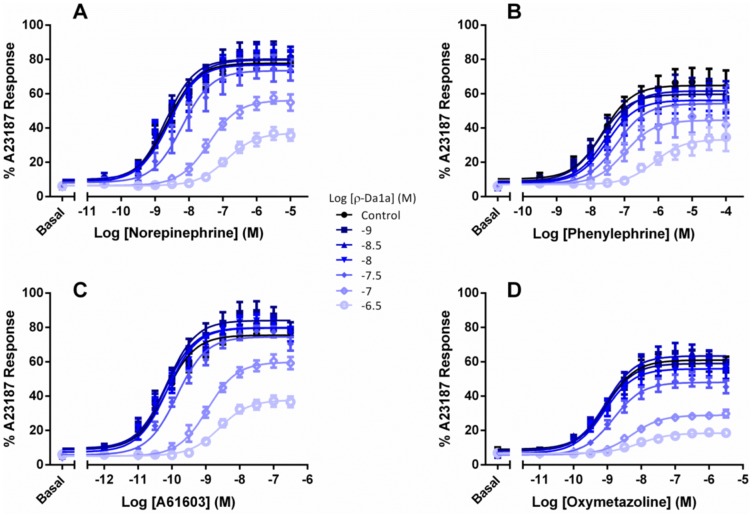
Figure 5. Concentration-response curves for stimulation of Ca2+ release by the α1A-AR.
Agonist responses represent the difference between basal fluorescence and the peak [Ca2+]i (reached within 20 sec of agonist addition), expressed as a percentage of the response to the Ca2+ ionophore A23187 (1 µM). Concentration-dependent Ca2+ release was stimulated by noradrenaline (panel A), phenylephrine (panel B), A61603 (panel C) or oxymetazoline (panel D). Concentration response curves were performed in the presence or absence of differing concentrations of ρ-Da1a (• control, ▪ 1 nM, ▴ 3 nM, ▾ 10 nM, ♦ 30 nM, ◊ 100 nM, ○ 300 nM). Values are means ± SEM of 3–4 independent experiments.

