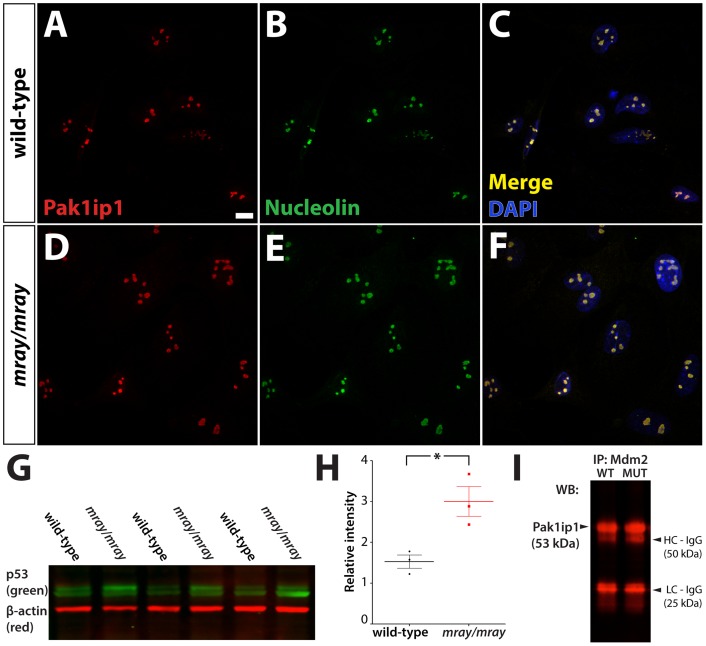
Figure 6. Pak1ip1 localizes to the nucleolus and its mutation increases Tp53 levels.
Intracellular distribution of Pak1ip1 revealed through immunofluorescence in cultured primary fibroblasts derived from wild-type (A–C) and homozygous mutant embryo (D–F). Fluorescent labeling for Pak1ip1 (A, D), nucleolin (B, E), and merged colors with DAPI (C, F) show an exclusively nucleolar localization in wild-type (A–C) and mutant cells (D–F) perfectly overlapping with the nucleolin signal. Scale bar is 10 μm. The western blot analysis in G performed on total lysate form E10.5 embryos reveals an upregulation of Tp53 in mray/mray mutants over wild-type littermates. The graph in H shows the results of the quantitative and statistical analysis of relative band intensity compared to background for wild-type (black) and mray/mray (red) samples. Dots correspond to individual data points, the thick lines show the mean, and the thin bars the standard error within the sample sets. A Student's t-test was used to assign significance to the data; a p-value <0.05 was obtained from the analysis. In I, the results of a Mdm2 co-IP are shown, which was used to pull Pak1ip1 protein from E13.5 embryo lysates. No differential signal intensity can be detected between wild-type and homozygous mutants for the subsequent western analysis of Pak1ip1.

