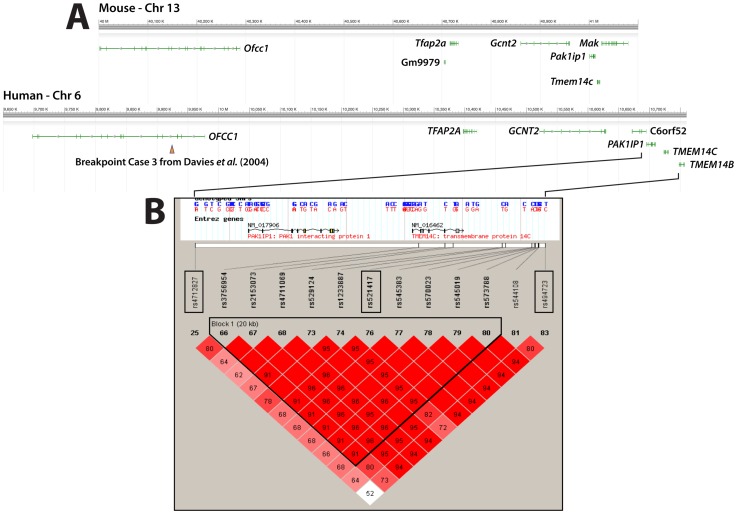
Figure 8. Mouse/Human synteny and Haploview output showing linkage disequilibrium relationships of the analyzed SNPs.
Approximately 1 Mb of syntenic aspects of mouse chromosome 13 and human chromosome 6 containing the Pak1ip1/PAK1IP1 genes are shown in National Center for Biotechnology Information Sequence Viewer 2.25 generated images in A. Positions and exon/intron structure of genes are indicated as green lines. In addition, the translocation breakpoint closest to PAK1IP1 reported in [8] is indicated through an arrowhead. In B the Haploview generated LD block structure encompassing 100 kb around PAK1IP1 for the Han Chinese and Japanese populations combined is presented. The upper part shows the genomic region of the PAK1IP1 gene and boxed the SNPs used in our association analysis and their physical position relative to PAK1IP1. Marker to marker D′ statistics are shown below with linkage disequilibrium (LD) blocks defined as solid spine of LD with a D′>0.8. Cells with no value indicate D′ = 1.0. Color intensity indicate strength of association, the darker the cell the greater the LD between individual SNPs. The haplotype block is outlined.

