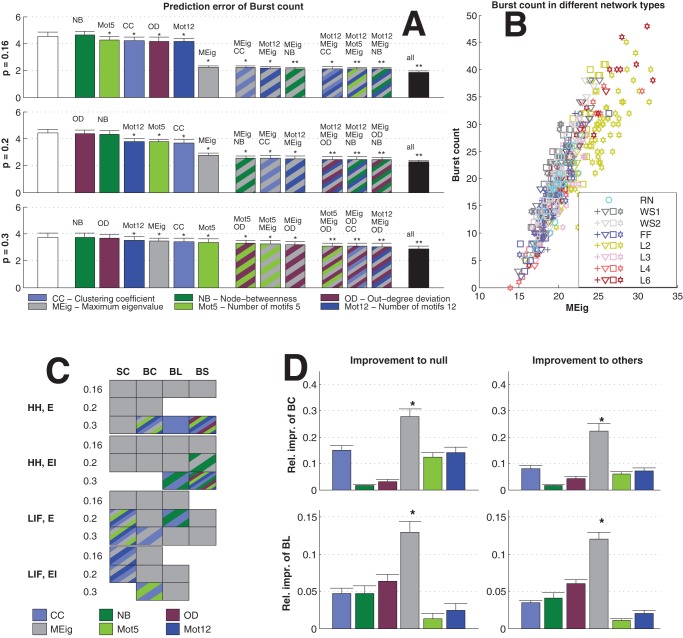
Figure 9. Maximum eigenvalue gives the best prediction of the activity properties across the 12 simulaton settings with power-law distributed in-degree.
A: Prediction errors of burst counts in simulation settings with the HH model, purely excitatory networks and power-law distributed in-degree. The average burst counts in the three simulation settings are 8.7 ( ), 20.0 (
 ) and 40.3 (
 ). See Fig. 6 for details. B: The distribution of the values of burst count in different networks with
  , plotted against the MEig of the underlying graph. See Fig. 6 for details. C: MEig is the best predictor of activity in most cases (32 unique or shared best performances, in comparison to 12 for CC, 6 for Mot5, 7 for Mot12, 3 for NB, and 2 for OD). See Fig. 7 for details. D: In the prediction of burst count and burst length, MEig brings the greatest improvement both to the null predictor and to the predictors based on other graph measures. See Fig. 8 for the details.

