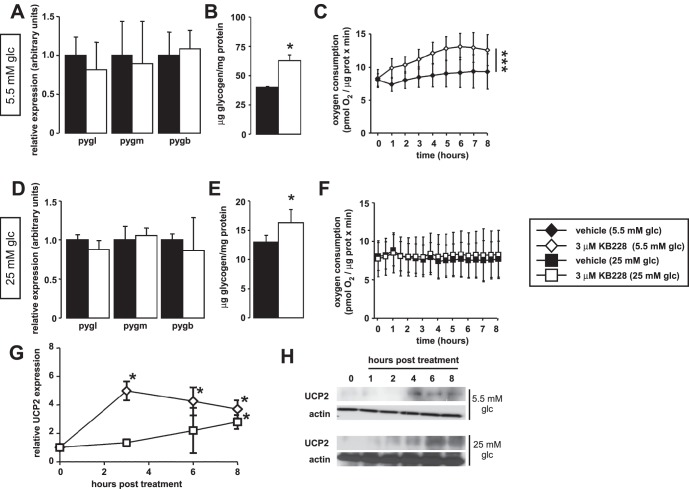
Figure 4. Metabolic effects of KB228 treatment in HepG2 cells.
(A–C) In vehicle or KB228-treated HepG2 cells (n = 3/3) under normoglycemic conditions (A) the expression of GP isoforms, (B) glycogen content and (C) cellular oxygen consumption (OCR) were determined (n = 47/47). (D–F) In vehicle or KB228-treated HepG2 cells (n = 3/3) under hyperglycemic conditions (D) the expression of GP isoforms, (E) glycogen content and (F) cellular oxygen consumption (OCR) were determined (n = 47/47). (G–H) In vehicle, or KB228-treated HepG2 cells (n = 4/4) under normoglycemic and hyperglycemic conditions UCP2 (G) mRNA and (H) protein levels were determined by RT-qPCR and Western blotting, respectively. Error is given as SD throughout the figure. * and *** indicate statistically significant difference between vehicle and KB228-treated groups at p<0.05, or p<0.001, respectively.

