
Figure 7. Model system comparison based on Inferelator regression models.
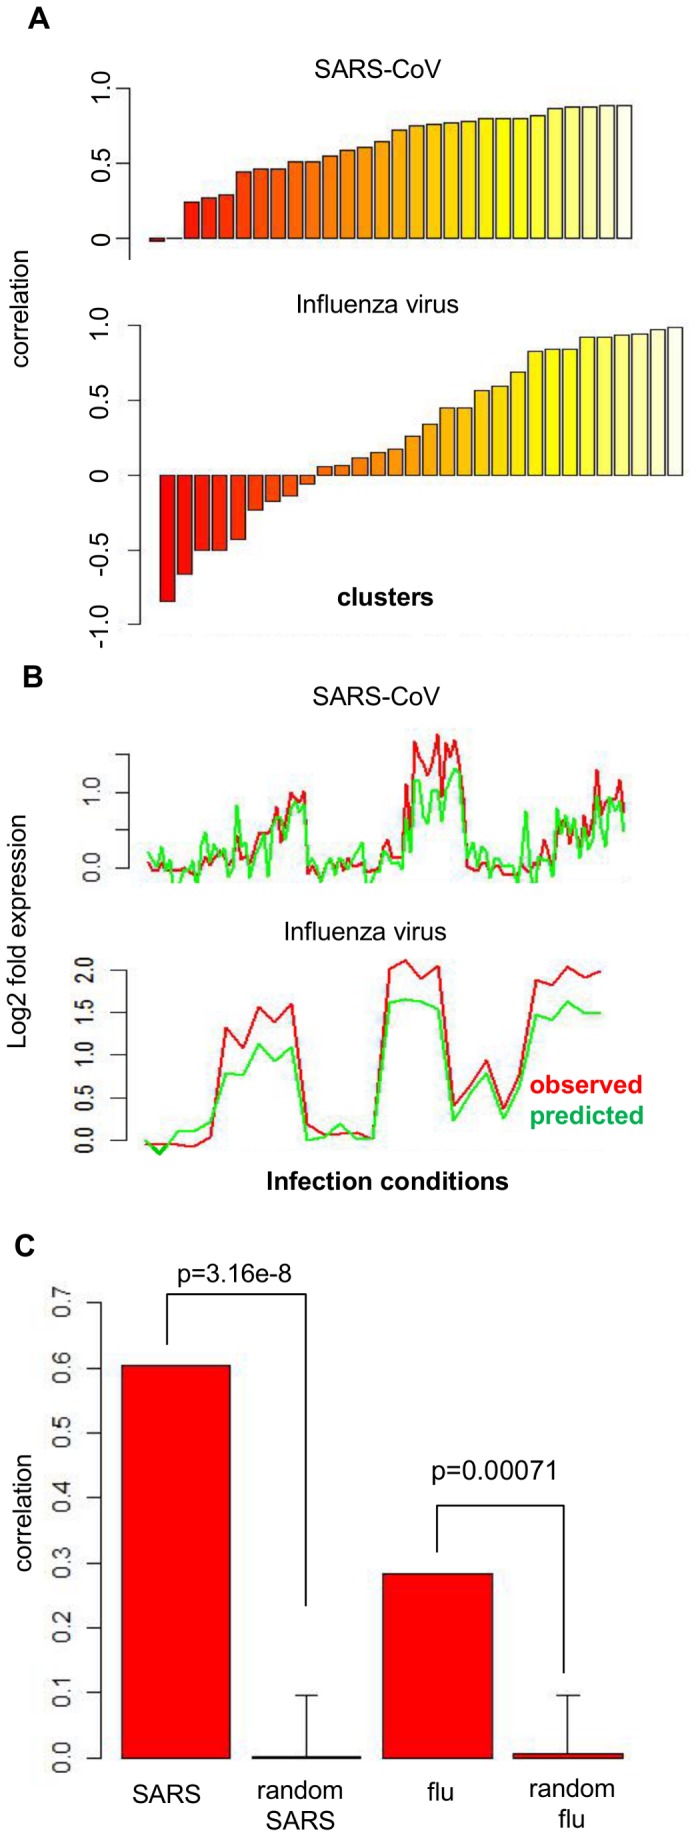
Regulatory influence models for each gene cluster of both viruses were applied to comparable datasets from distinct model systems. For SARS-CoV, regulatory influences inferred from Calu3 data were applied to SARS-CoV infection data from a primary human airway epithelial cell model system. For influenza, the Calu3 model was applied to influenza infection data from C57BL/6 mice. The observed gene expression profile of the non-Calu3 data clusters was compared to the predicted gene expression profile based on the Calu3 model. Correlations were calculated for this comparison from each cluster and are shown in A. In B, a sample expression profile from a highly-predictive cluster from each virus is shown with the observed non-Calu3 expression profile shown in red, compared to the predicted expression profile from the Calu3 model in green. In C, the average cluster correlation for the SARS-CoV and influenza comparisons is shown, in comparison to the correlation obtained from applying 100 random models to the corresponding alternative model system. P-values were obtained by comparing each correlation with the distribution of 100 correlations based on random models.