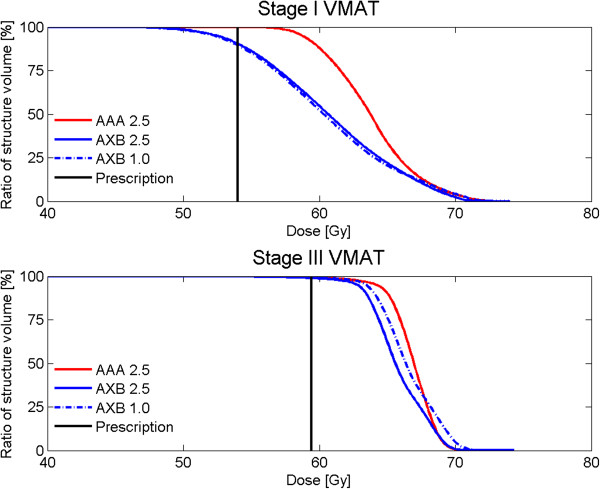
Figure 2.
Dose volume histogram comparisons of PTV doses between algorithms and grid sizes. Comparison of dose volume histograms of the planning target volume (PTV) between AAA grid size 2.5 mm, Acuros XB grid size 2.5 mm and Acuros XB grid size 1.0 mm of (top) a stage I and (bottom) a stage III lung patient. The black vertical lines indicate the prescription: The dose that has to cover 99% of the PTV, respectively, 54.0 Gy for stage I and 59.4 Gy for stage III.

