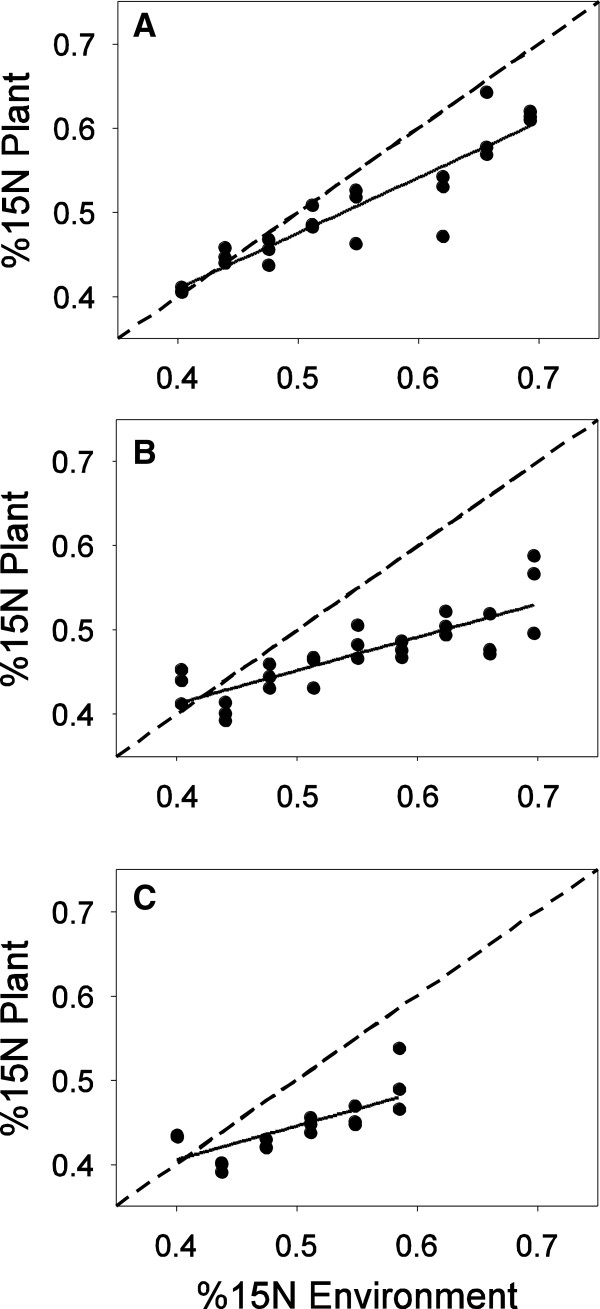
Figure 4.
Percent 15N available in the nutrient solutions versus percent 15N present in the plants. Deviations of actual uptake (solid lines) below the null expectation of no preference (1:1 dotted line) indicate that the plant preferentially captured the unlabeled nitrogen source. (A) Nitrate and 15glutamine: nitrate preferred. (B) Nitrate and 15asparagine: nitrate preferred. (C) Glutamine and 15asparagine, glutamine preferred. Some plants were so small in the glutamine and asparagine treatment and it was not possible to obtain stable isotopes measurements resulting in missing data for panel (C).

