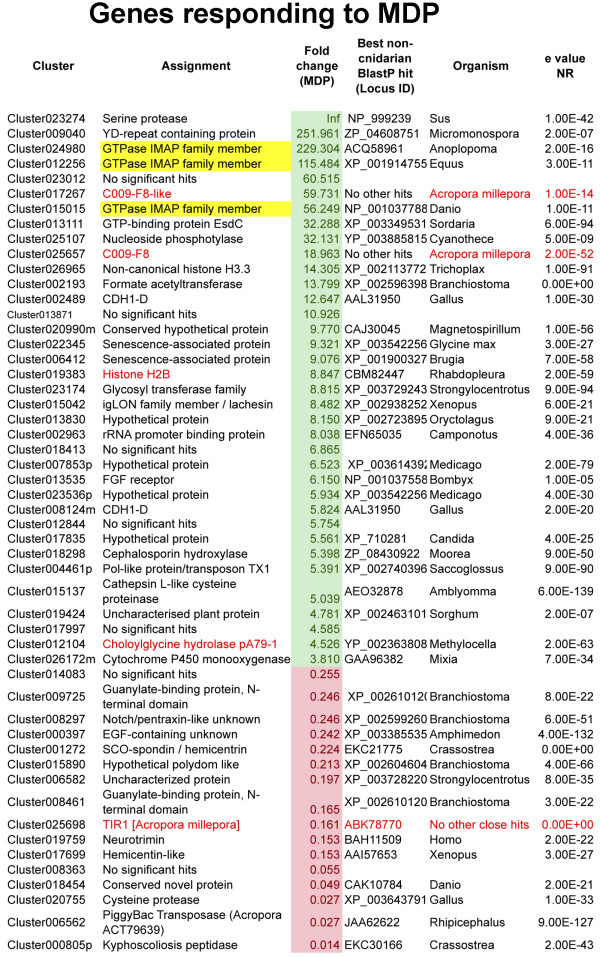
Figure 3.
Transcriptome clusters differentially regulated under MDP challenge; up-regulated clusters are shown in green, down-regulation is indicated in red. The GiMAP genes are highlighted in yellow. BlastX comparisons were carried out against the NR database via NCBI using a cutoff of E-5. For comparisons to A. digitifera and Nematostella, see Additional file 3.

