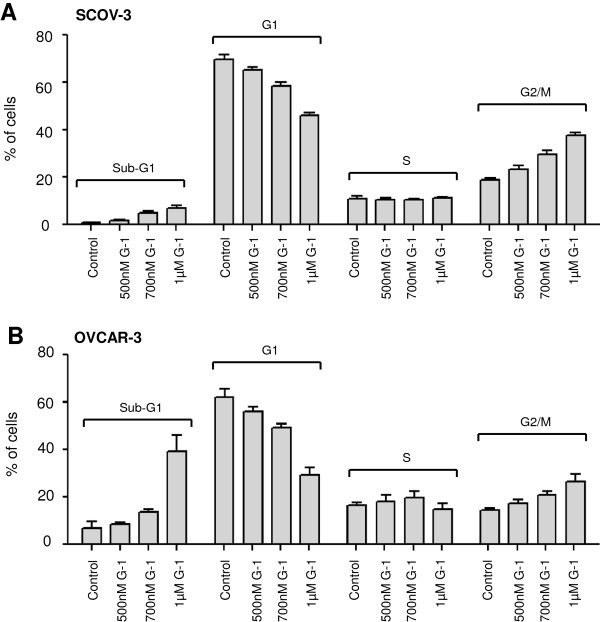
Figure 5.
Effects of G-1 on cell cycle progression in ovarian cancer cells. Cell cycle distribution of (A) SCOV-3 and (B) OVCAR-3 cells treated or not with indicated concentrations of G-1 for 48 h was determined by flow cytometry analysis. Each experiment was repeated at least three times. The results are expressed as means ± SD.

