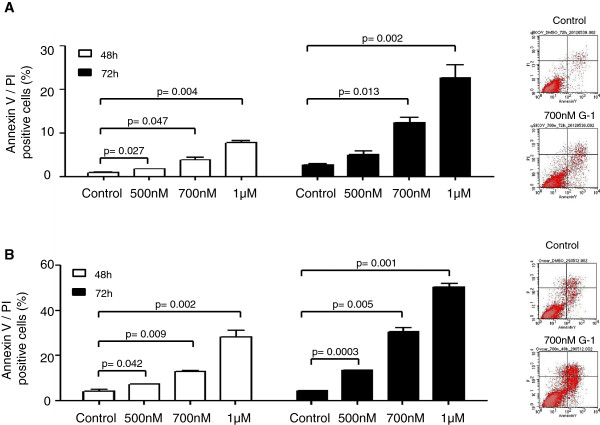
Figure 6.
G-1 induces apoptosis in ovarian cancer cells. A) SCOV-3 and B) OVCAR-3 cells were treated with control or with indicated concentrations of G-1 for 48 h, afterwards cells were stained with annexin V/propidium iodide and analyzed by FACS flow cytometry. Each experiment was repeated at least three times. The results are shown as means ± SD. Representative examples of distribution of SCOV-3 and OVCAR-3 cells treated with control (upper panel) or 700 nM G-1 (lower panel) is shown.

