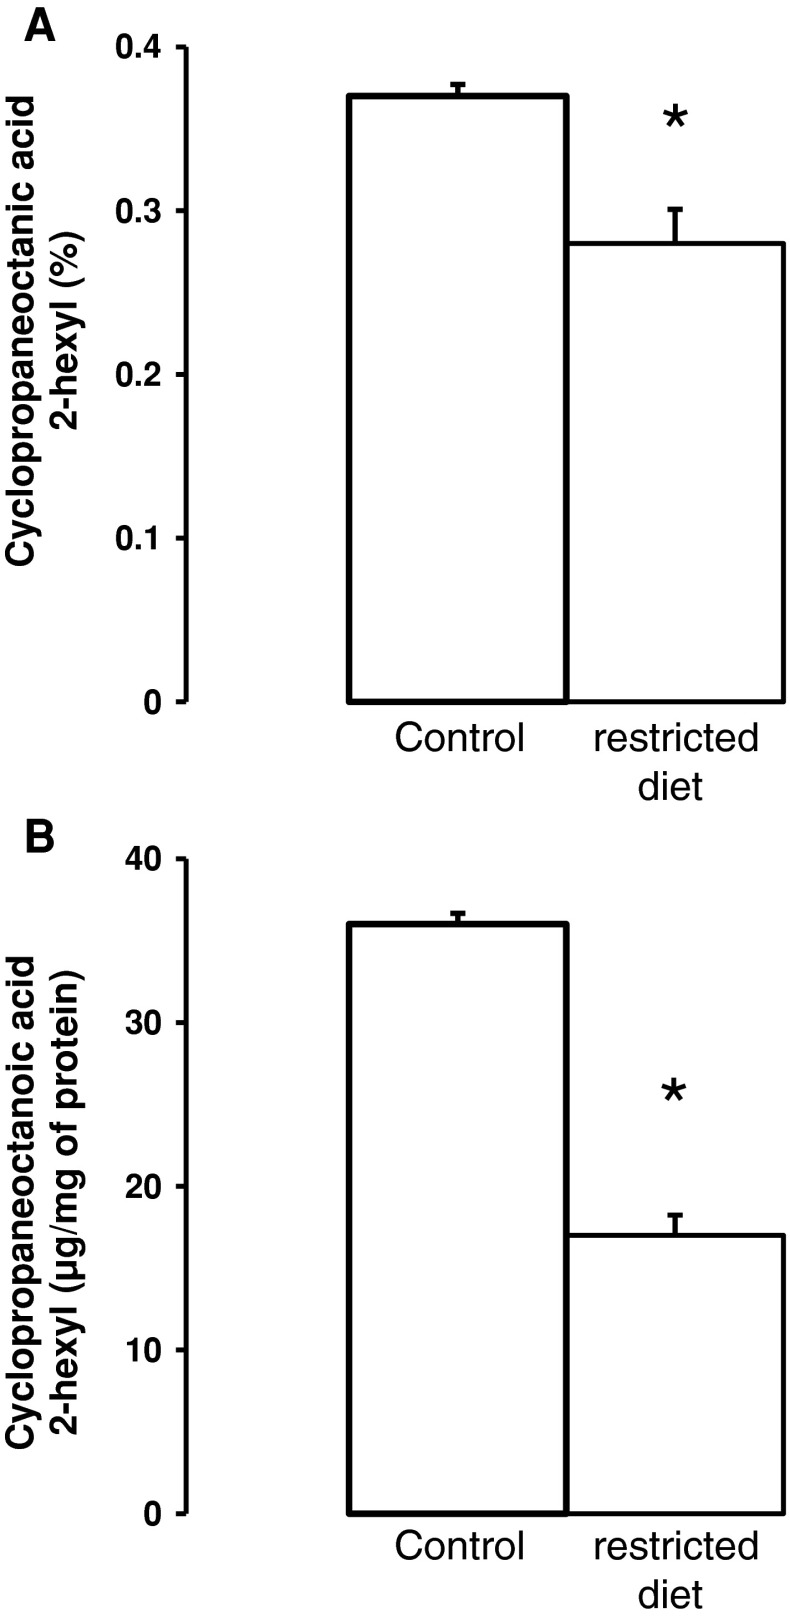
Fig. 4.
Cyclopropaneoctanoic acid 2-hexyl content of adipose tissue of control rats and rats maintained on a restricted diet for 1 month. Data are expressed as percentages of cyclopropaneoctanoic acid 2-hexyl composition of adipose tissue (a) or as μg of cyclopropaneoctanoic acid 2-hexyl per mg of adipose tissue protein b. Data are presented as means ± SD. *p < 0.05

