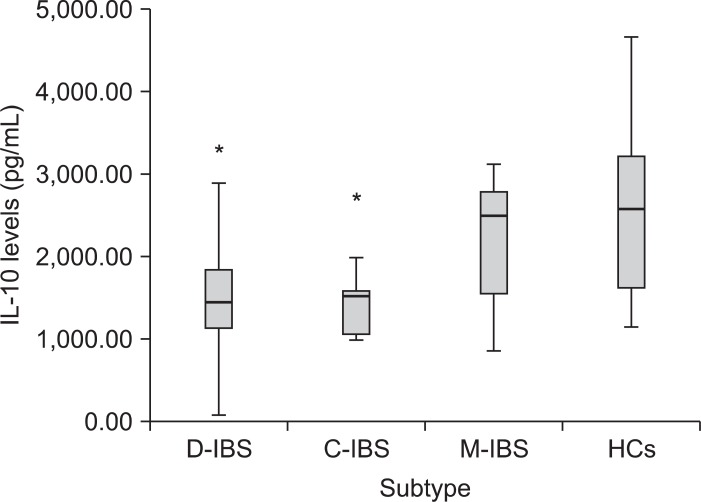
Fig. 1.
Box plot of interleukin (IL)-10 levels following 5 ng/mL lipopolysaccharide stimulation in irritable bowel syndrome (IBS) subtype and healthy controls diarrhea-predominant IBS [D-IBS]: 1,532.68±870.22 vs. constipation-predominant IBS [C-IBS]: 1,428.39±413.66 vs. mixed IBS [M-IBS]: 2,159.44±265.48 vs. HCs [healthy controls]: 2,521.16±1,046.06 pg/mL).
*Statistically significant, p<0.05.

