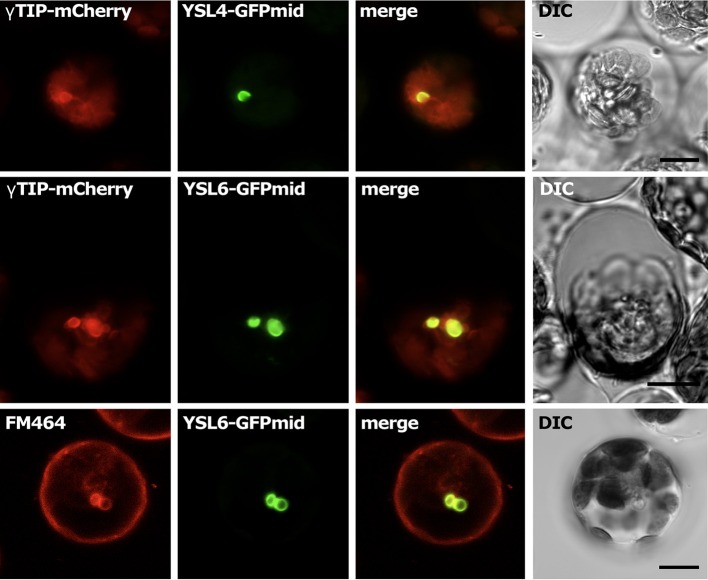
Figure 4.
Subcellular localization of AtYSL4 and AtYSL6 in protoplasts. Each horizontal row of four images shows (left to right) red fluorescence, green fluorescence, merged red and green images, and differential interference contrast. Top row: protoplast co-transformed with AtYSL4-GFPmid and γ -TIP-mCherry. Middle row: protoplast co-transformed with AtYSL6-GFPmid and γ -TIP-mCherry. Bottom row: protoplast transformed with AtYSL6-GFPmid and stained with the membrane-selective dye FM-464. Scale bar = 10 um.

