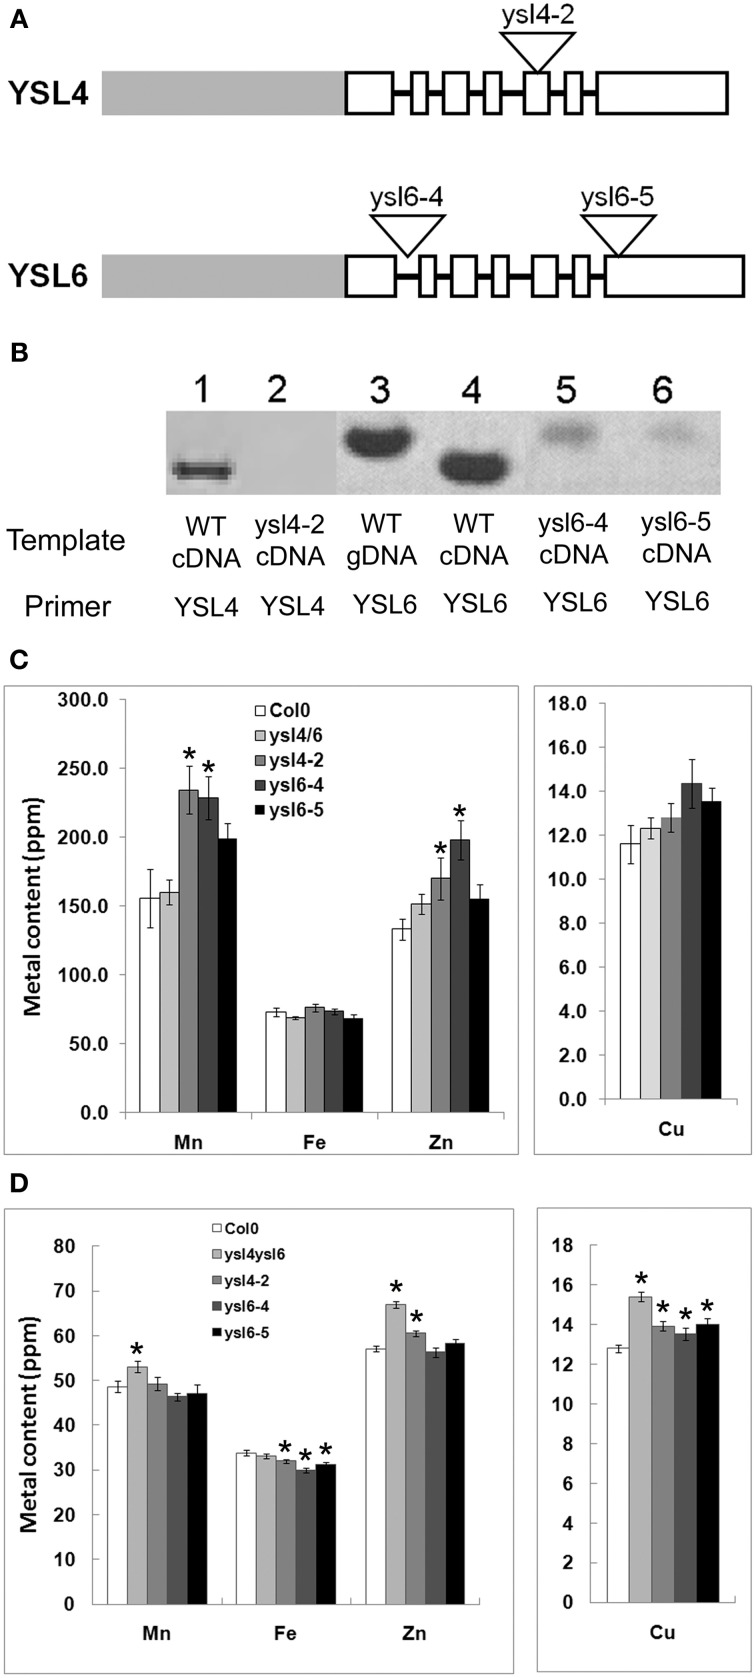
Figure 6.
ysl4-2, ysl6-4 and ysl6-5 null mutants. (A) Schematic representation of the structure of AtYSL4 and AtYSL6. Gray bars represent promoter regions. White boxes represent exons. Black lines represent introns (not to scale). Triangles represent insertion sites of T-DNAs in the Salk T-DNA insertion mutants, ysl4-2 (SALK_025447), ysl6-4 (SALK_119560), and ysl6-5 (SALK_093392). (B) Detection of AtYSL4 and AtYSL6 mRNA. RT-PCR was performed using RNA extracted from the leaves of wild type (WT), ysl4-2, ysl6-4, ysl6-5, and ysl4ysl6 plants. WT genomic DNA (gDNA) was also included as a control. Lane 1: WT cDNA with AtYSL4 specific primers. Lane 2: ysl4-2 cDNA with AtYSL4 specific primers. Lane 3: WT gDNA with AtYSL6 specific primers. Lane 4: WT cDNA with YSL6 specific primers. Lane 5: ysl6-4 cDNA with YSL6 specific primers. Lane 6: ysl6-5 cDNA with AtYSL6 specific primers. (C) and (D) ICP-MS determination of metal concentrations of Col-0, ysl4-2, ysl6-4, ysl6-5, and ysl4ysl6. Results are given as ppm. Error bars represent standard error. Each sample contains 10 replicates. Asterisks indicate P < 0.05 by t-test. (C) Metal concentrations of leaves. (D) Metal concentrations of seeds.

