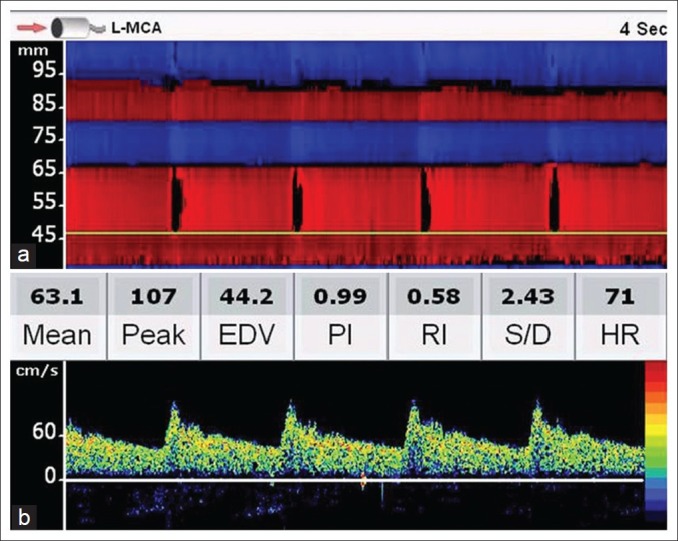
Figure 2.

PMD screen following a trans-temporal insonation. Upper panel (a) shows the M-mode appearance of various arteries. The red signal up to 65 mm means that the flow is toward the probe (MCA flow) and from 65 mm to 80 mm, away from the probe (ACA flow). Red color beyond 80 mm suggests flow in the contralateral A1 ACA and the blue signal beyond 92 mm represents contralateral MCA. Lower panel (b) shows a normal TCD spectrum at a depth of 47 mm. Note the rapid systolic acceleration and stepwise deceleration during the diastole and significant end-diastolic velocity
