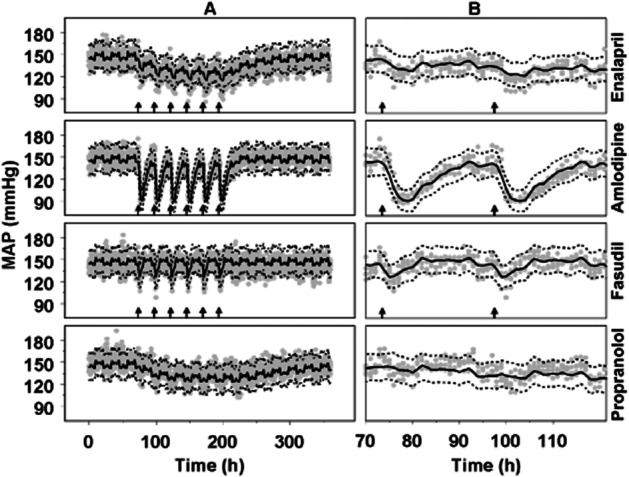
Figure 3.

Visual predictive check of the description of the data from the repeated dosing Study 1 by the developed drug-independent CVS model. (A) Full-time scale; (B) Expansion of the responses to first two administrations of each drug. The grey dots represent the observations in SHR after administration of enalapril (30 mg·kg−1 po) and amlodipine (10 mg·kg−1 p.o.), fasudil (30 mg·kg−1 p.o.) and propranolol (1 mg·mL−1 in drinking water); n = 5 SHR per drug. The continuous lines represent the predicted median and the dashed lines represent the predicted lower and upper limit of the 90% prediction interval. The arrows indicate the six daily administrations of each drug.
