
Figure 2.
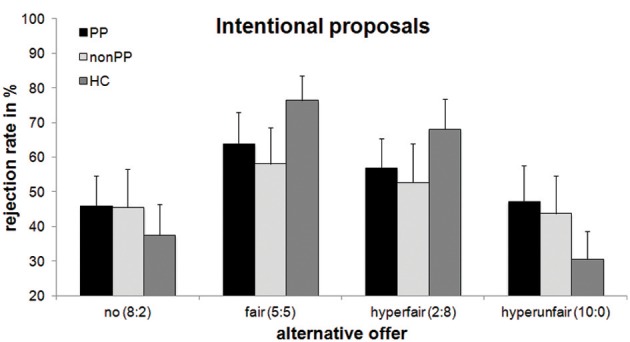
Rejection rates of intentional unfair offers with regard to alternative offers and group. Mean percentage and standard errors of rejection of 8:2-offers are displayed. PP, offenders with psychopathy; non-PP, offenders without psychopathy; HC, healthy controls.