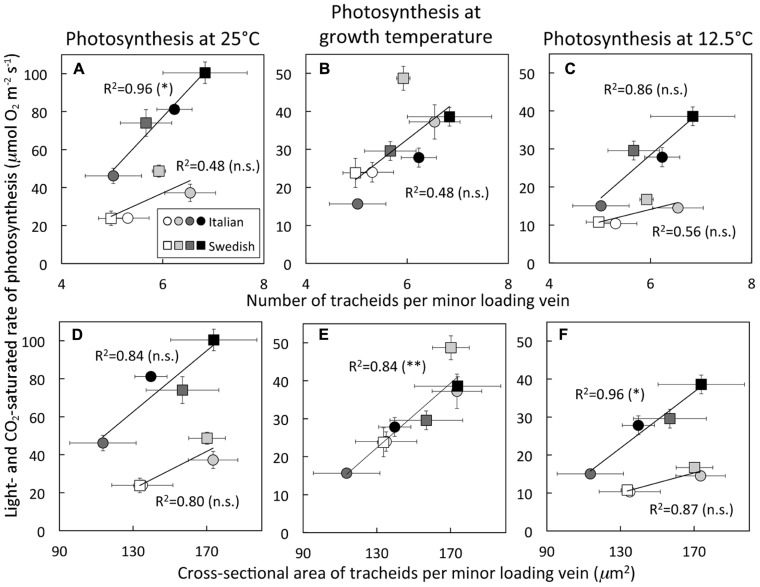
FIGURE 5.
Light- and CO 2-saturated rate of oxygen evolution, determined at either 25 or 12.5°C, versus (A–C) the number of tracheids per minor loading vein or (D–F) the cross-sectional area of tracheids per minor loading vein for Italian (circles) and Swedish (squares) ecotypes of A. thaliana grown at two leaf temperatures and two PFDs. Plants were grown under four different conditions (24–26°C and 400 μmol photons m-2 s-1, open symbols; 24–26°C and 1000 μmol photons m-2 s-1, light gray symbols; 12–16°C and 400 μmol photons m-2 s-1, dark gray symbols; 12–16°C and 1000 μmol photons m-2 s-1, black symbols). Mean ± standard deviation shown for light- and CO2-saturated rates of photosynthetic oxygen evolution, and mean ± standard error of the mean shown for number and cross-sectional area of tracheids per minor loading vein (n = 4 plants). Linear regression lines are shown with the following equations: (A) growth at 14°C line by y = 28.4x - 93.4 and growth at 25°C line by y = 12.0x - 35.1, (B) y = 10.5x - 30.4, (C) growth at 14°C line by y = 11.6x - 41.0 and growth at 25°C by y = 3.3x - 5.8, (D) growth at 14°C line by y = 0.8x - 41.9 and growth at 25°C by y = 0.5x - 42.1, (E) y = 0.4x - 34.0, and (F) growth at 14°C line by y = 0.4x - 26.2 and growth at 25°C line by y = 0.1x - 7.0. Level of significance (in parentheses) indicated as follows: *P < 0.05, **P < 0.01, and n.s., not statistically significant.

