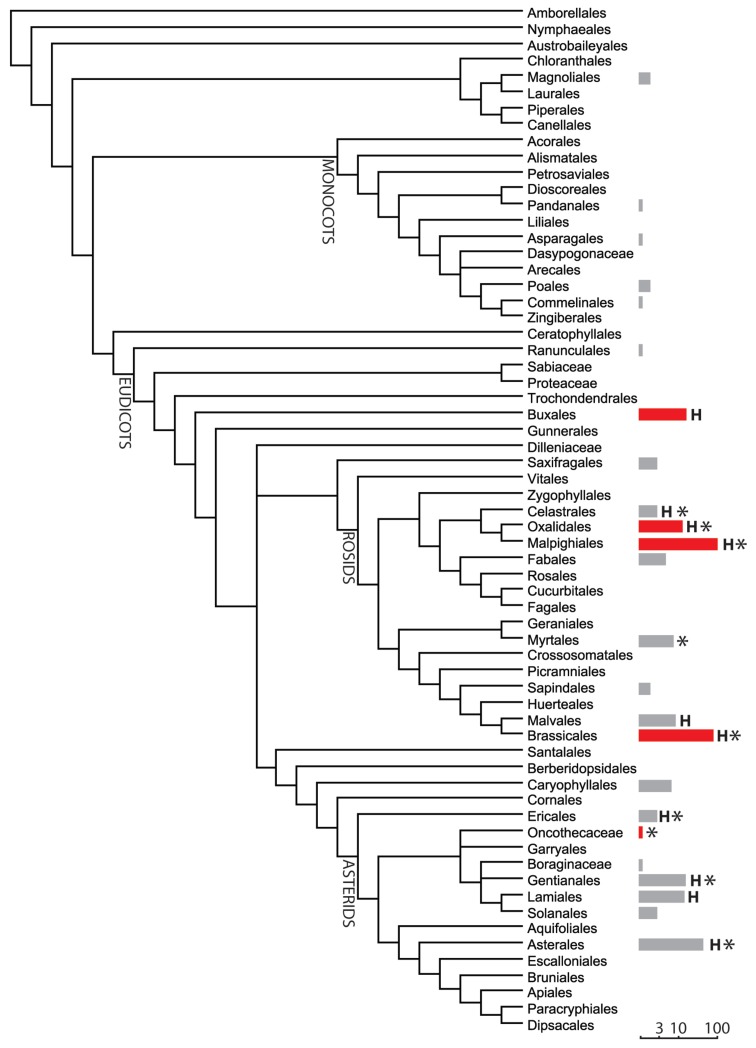
Figure 1.
Phylogenetic distribution of nickel hyperaccumulators using APG III classification. The number of Ni hyperaccumulator in each order is presented as a bar (logarithmic scale). The red bar indicates that the observed number of hyperaccumulators significantly exceed the theoretical number (hyperaccumulating species randomly distributed using a binomial law with a Bonferroni correction for multiple tests). H, indicates the presence of hypernickelophore species accumulating more than 10,000 ppm nickel. *, indicates the presence of hyperaccumulators from New Caledonia.

