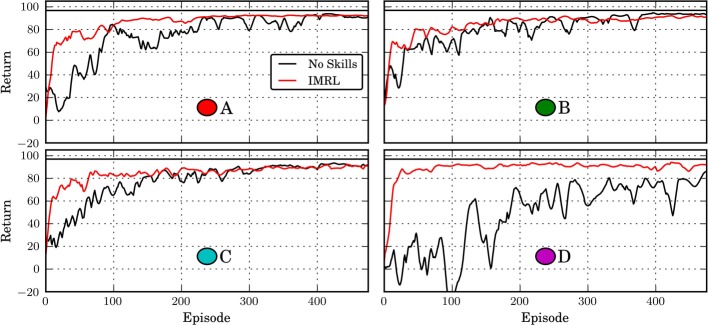
Figure 10.

Return of IMRL agent in the Octopus domain under the “novelty” motivation after 50,000 developmental steps. The circle patches indicate the respective targets used in the runs (compare Figure 8). “No Skills” shows the performance of an agent that does not learn skills and has no developmental period. The horizontal black line shows the average cost of the policy learned by the monolithic agent after 2500 episodes. All curves show median performance over 5 independent runs and have been smoothened by a moving window average with window length 25.
